Multi-Spectral Temporal Synchronization: A New Framework for Liquidity Activation in Financial Markets
Introduction
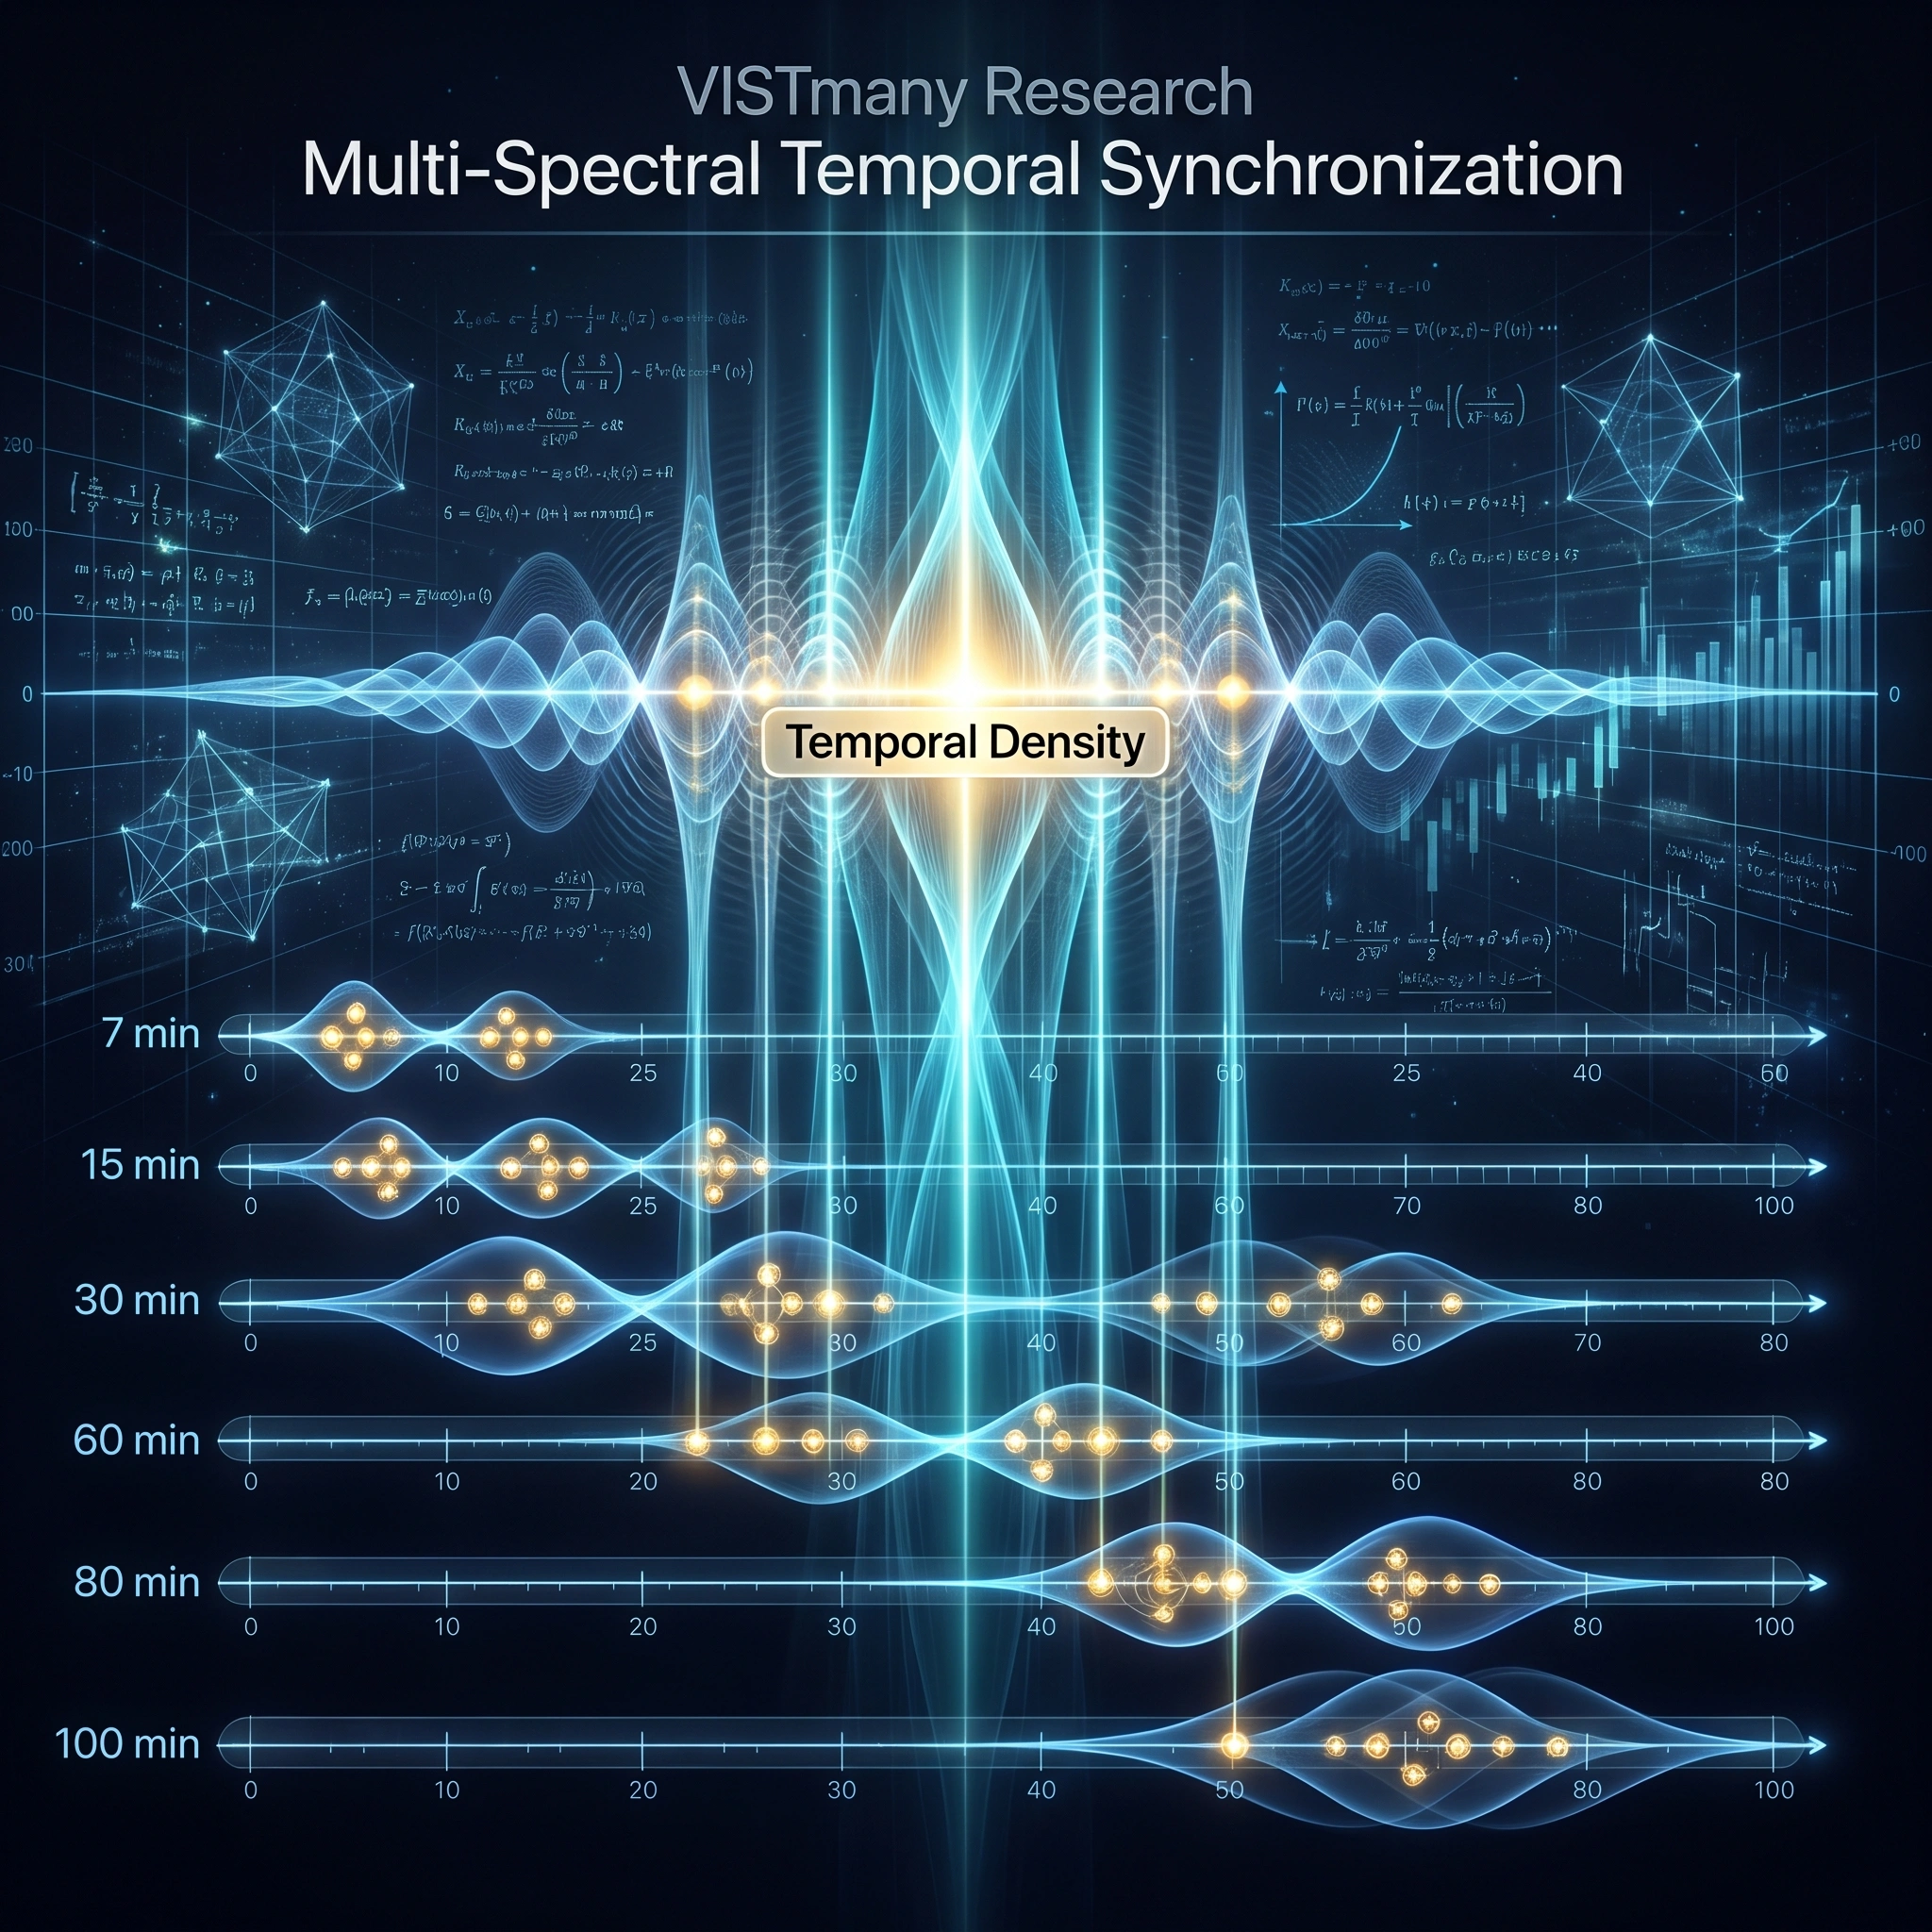
Financial markets are governed by numerous independent processes operating on different temporal scales. Institutional execution algorithms, liquidity redistribution, market participation, options expiration dynamics, and macroeconomic information flows all contribute to the temporal complexity of modern markets. Traditional analytical approaches attempt to isolate one dominant cycle. The VISTmany methodology proposes an alternative hypothesis: Market behavior is produced by the synchronization of multiple independent temporal structures rather than by a single dominant cycle. This synchronization forms the basis of Liquidity Activation Points (LAP).
Independent Temporal Spectra
Within VISTmany Research, every calculation interval generates its own independent temporal spectrum.
For example:
- 7-minute spectrum,
- 15-minute spectrum,
- 30-minute spectrum,
- 60-minute spectrum,
- 80-minute spectrum,
- 100-minute spectrum.
Horizontal Spectra
A Horizontal Temporal Spectrum consists of several closely located LAPs generated within the same calculation interval. Example:
A 60-minute calculation produces the following projected timings:
10:18, 10:20, 10:22, 10:23, 10:24.
Although these timings differ by only a few minutes, together they represent one coherent horizontal spectrum rather than isolated signals.
The market should therefore be viewed as approaching a temporal activation zone instead of a single exact timestamp.
Vertical Synchronization
The true strength of the VISTmany methodology appears when several horizontal spectra overlap.
Example:
7-minute spectrum: 10:20, 10:21, 10:22,
15-minute spectrum: 10:19, 10:20, 10:22,
30-minute spectrum: 10:20, 10:21,
60-minute spectrum: 10:20, 10:22,
100-minute spectrum: 10:21.
Instead of isolated projections, multiple independent spectra mathematically converge into the same temporal region. This phenomenon creates Multi-Spectral Temporal Synchronization.
Temporal Density
The degree of overlap between horizontal spectra defines Temporal Density. Higher Temporal Density implies that more independent temporal structures predict activity within the same time interval. The VISTmany framework interprets this as an increase in the probability that institutional liquidity algorithms will become active. Importantly, Temporal Density does not predict direction. It predicts the increasing likelihood of market activation.
For the formal definitions of these concepts, see Temporal Density, Temporal Spectrum, and Temporal Space in the VISTmany Terminology reference page.
Scientific Significance
Unlike conventional cycle theory, MSTS treats financial markets as dynamic systems composed of interacting temporal layers. Each spectrum contributes independently to the global temporal structure. Market activity therefore emerges through synchronization rather than through isolated periodicity. This interpretation aligns more closely with complex systems theory than with classical deterministic cycle analysis.
Conclusion
The concept of Multi-Spectral Temporal Synchronization extends the theoretical foundation of Temporal Space by explaining how independent temporal structures interact to generate significant liquidity activation. Rather than searching for a single dominant market cycle, the VISTmany framework studies the mathematical convergence of multiple temporal spectra. This approach provides a new perspective on forecasting financial market activity and establishes an additional theoretical layer supporting Liquidity Activation Points (LAP).
The concepts used throughout this article are formally defined in the VISTmany Terminology page, especially Temporal Space, Temporal Spectrum, Temporal Density, and Liquidity Activation Point (LAP).