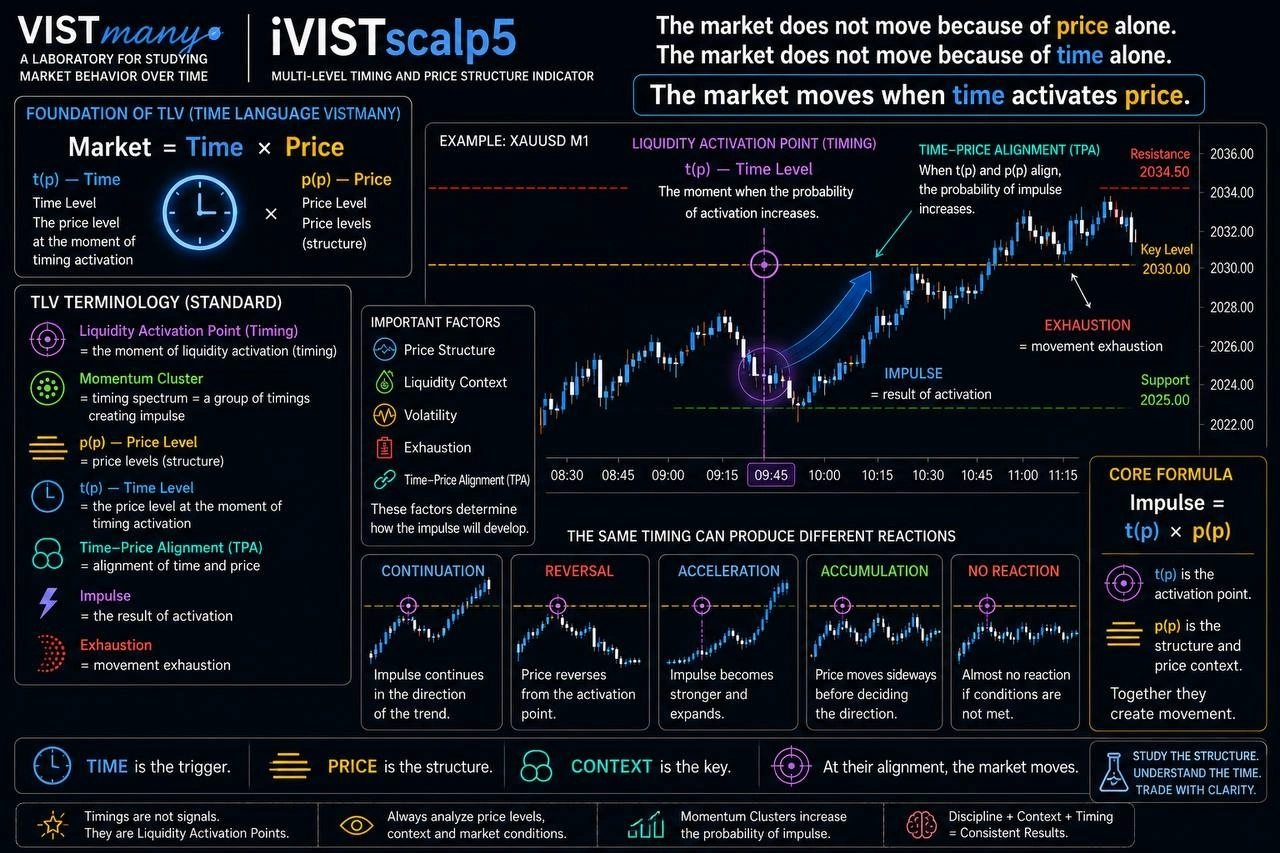
Timing, also called a Liquidity Activation Point (LAP), is a calculated future time window that signals when to observe market behavior. A timing is not an instruction to trade: study the surrounding price context and decide whether to act or ignore it. For the definition and related concepts, see the VISTmany terminology guide.
Use the iVISTscalp5 FAQ for practical answers, and visit the Research Journal for the broader framework behind this approach.
Timings work schedule:
From 03:00 to 19:00 (UTC+2, winter)
From 04:00 to 20:00 (UTC+3, summer)
The forecast is calculated for the week ahead for any financial instrument (more than 125) in the mt5 terminal.
The indicator currently calculates forecasts for 8 financial instruments on the website. (The number of financial instruments on the site may vary.)
Gradually, new trading tools will be added to the site.
1. Choose discipline, independence, consistency and training.
2. You study the basic concepts of the Time-Based Market Analysis in the timing school.
3. From the first day, you start trading according to the rules of the Time-Based Market Analysis on a demo account in mt5.
4. If you need a broker, review the broker registration information before deciding whether to register.
5. Choose one financial instrument. You study the operation of timings and trade forecasts on it. Then you can use a lot of tools in your work.
6. To quickly understand how timings work, regularly test the iVISTscalp5 indicator. It doesn't cost you anything, but you get a visualization of the scalping forecast process. Additionally, you study the main levels of the iVISTscalp5 indicator. And also see how the Time-Based Market Analysis works. And how the forecasts of our system are fulfilled.
7. Watch the video of trading by timings (forecasts) on our YouTube channel.
8. Study the dynamics of the price of a financial instrument when the iVISTscalp5 indicator forecast consists only of sell or buy timings in a row. An analysis of this process can be done in the mt5 strategy tester.
9. Observe how the price of a financial instrument moves from timing to timing. How the price tests the previous time levels (LAP).
10. Ignore timings that have a small forecast for profit. Remember that our forecast for profit is an average value. Therefore, always set a profit less than stated in the forecast. If possible, transfer the order to breakeven.
Methodology of Applying Time Cycles (LAP) within the iVISTscalp5 Analytical Framework
Abstract
The iVISTscalp5 algorithm is based on the calculation of Liquidity Activation Points (LAP). These points represent calculated time intervals within which the probability of a directional shift in market quotes statistically increases. The predictive model encompasses three components: activation time, expected vector, and calculated volatility range (amplitude).
The fundamental postulate of this methodology states: Timing determines the moment of heightened analytical control, whereas the actual price reaction acts as the entry trigger. The structural market context holds unconditional priority over an isolated time value.
The official operational guidelines for the LAP system are outlined below.
1. Priority of Price Reaction over the Time Factor
The arrival of the calculated LAP time is not a sufficient or independent basis for executing a trading order. The occurrence of a timing requires the operator (trader) to transition into an observation mode. Trade initiation is permitted strictly after the asset's price reaction has been confirmed and verified for alignment with the algorithmically predicted vector.
2. Analysis of Preceding Structural Dynamics
The execution efficiency of a time cycle is directly correlated with the market phase preceding the LAP:
For executing a BUY scenario, it is statistically optimal for a downward price movement to form prior to the calculated time.
For executing a SELL scenario, it is advisable to observe an upward dynamic before the timing activates.
These criteria are governed by the mechanics of market liquidity accumulation. Additionally, the principle of market asymmetry must be considered: the conditions for forming downtrends and uptrends differ; therefore, the rules for BUY and SELL orders are not subject to direct extrapolation or mirrored application.
3. Factoring in the Inertia of the Dominant Price Impulse
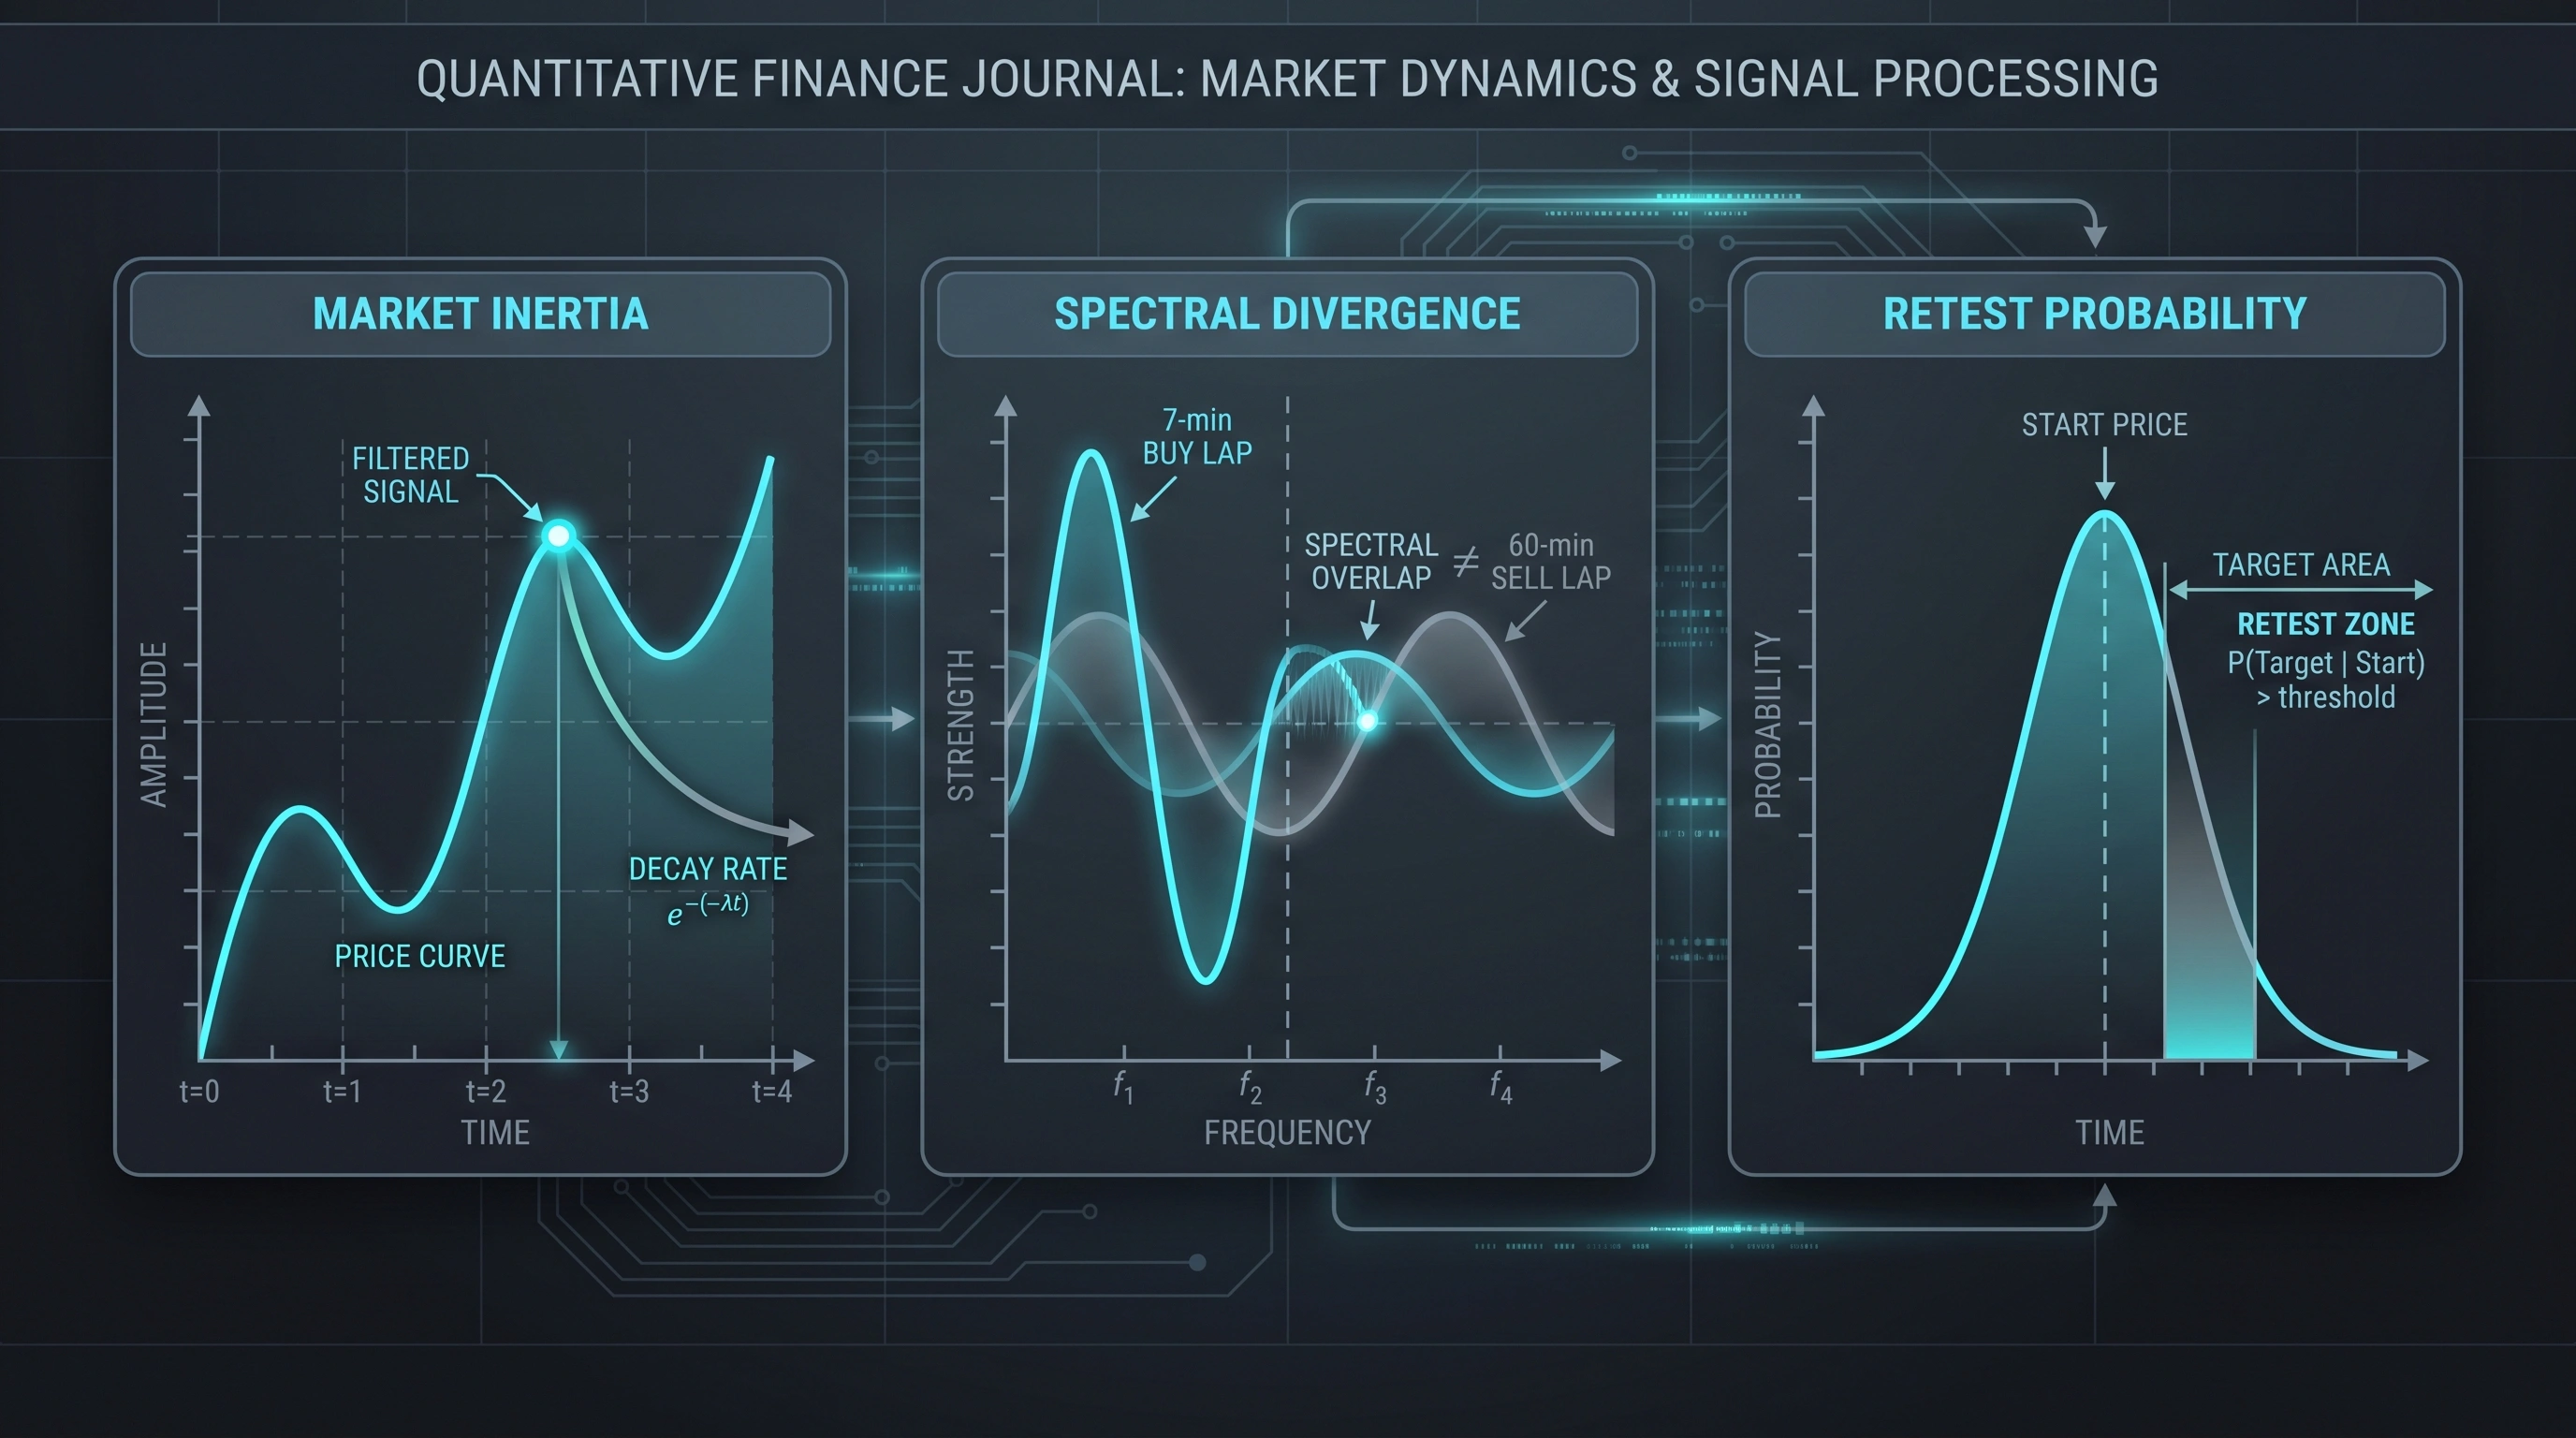
Opening positions against a pronounced impulsive movement based solely on calculated timing is unacceptable. The formation of a SELL signal following an anomalous decline, or a BUY signal following a relentless rally, requires a critical assessment of the macrostructure. Timing is incapable of neutralizing market inertia without the prior formation of consolidation patterns.
4. Multi-Timeframe Synchronization and Amplitude Correlation
The optimal analytical process is based on the conjunctive use of time cycles of varying orders. The iVISTscalp5 algorithm incorporates a physical principle of proportionality: the timing period directly correlates with the scale of the expected reaction.
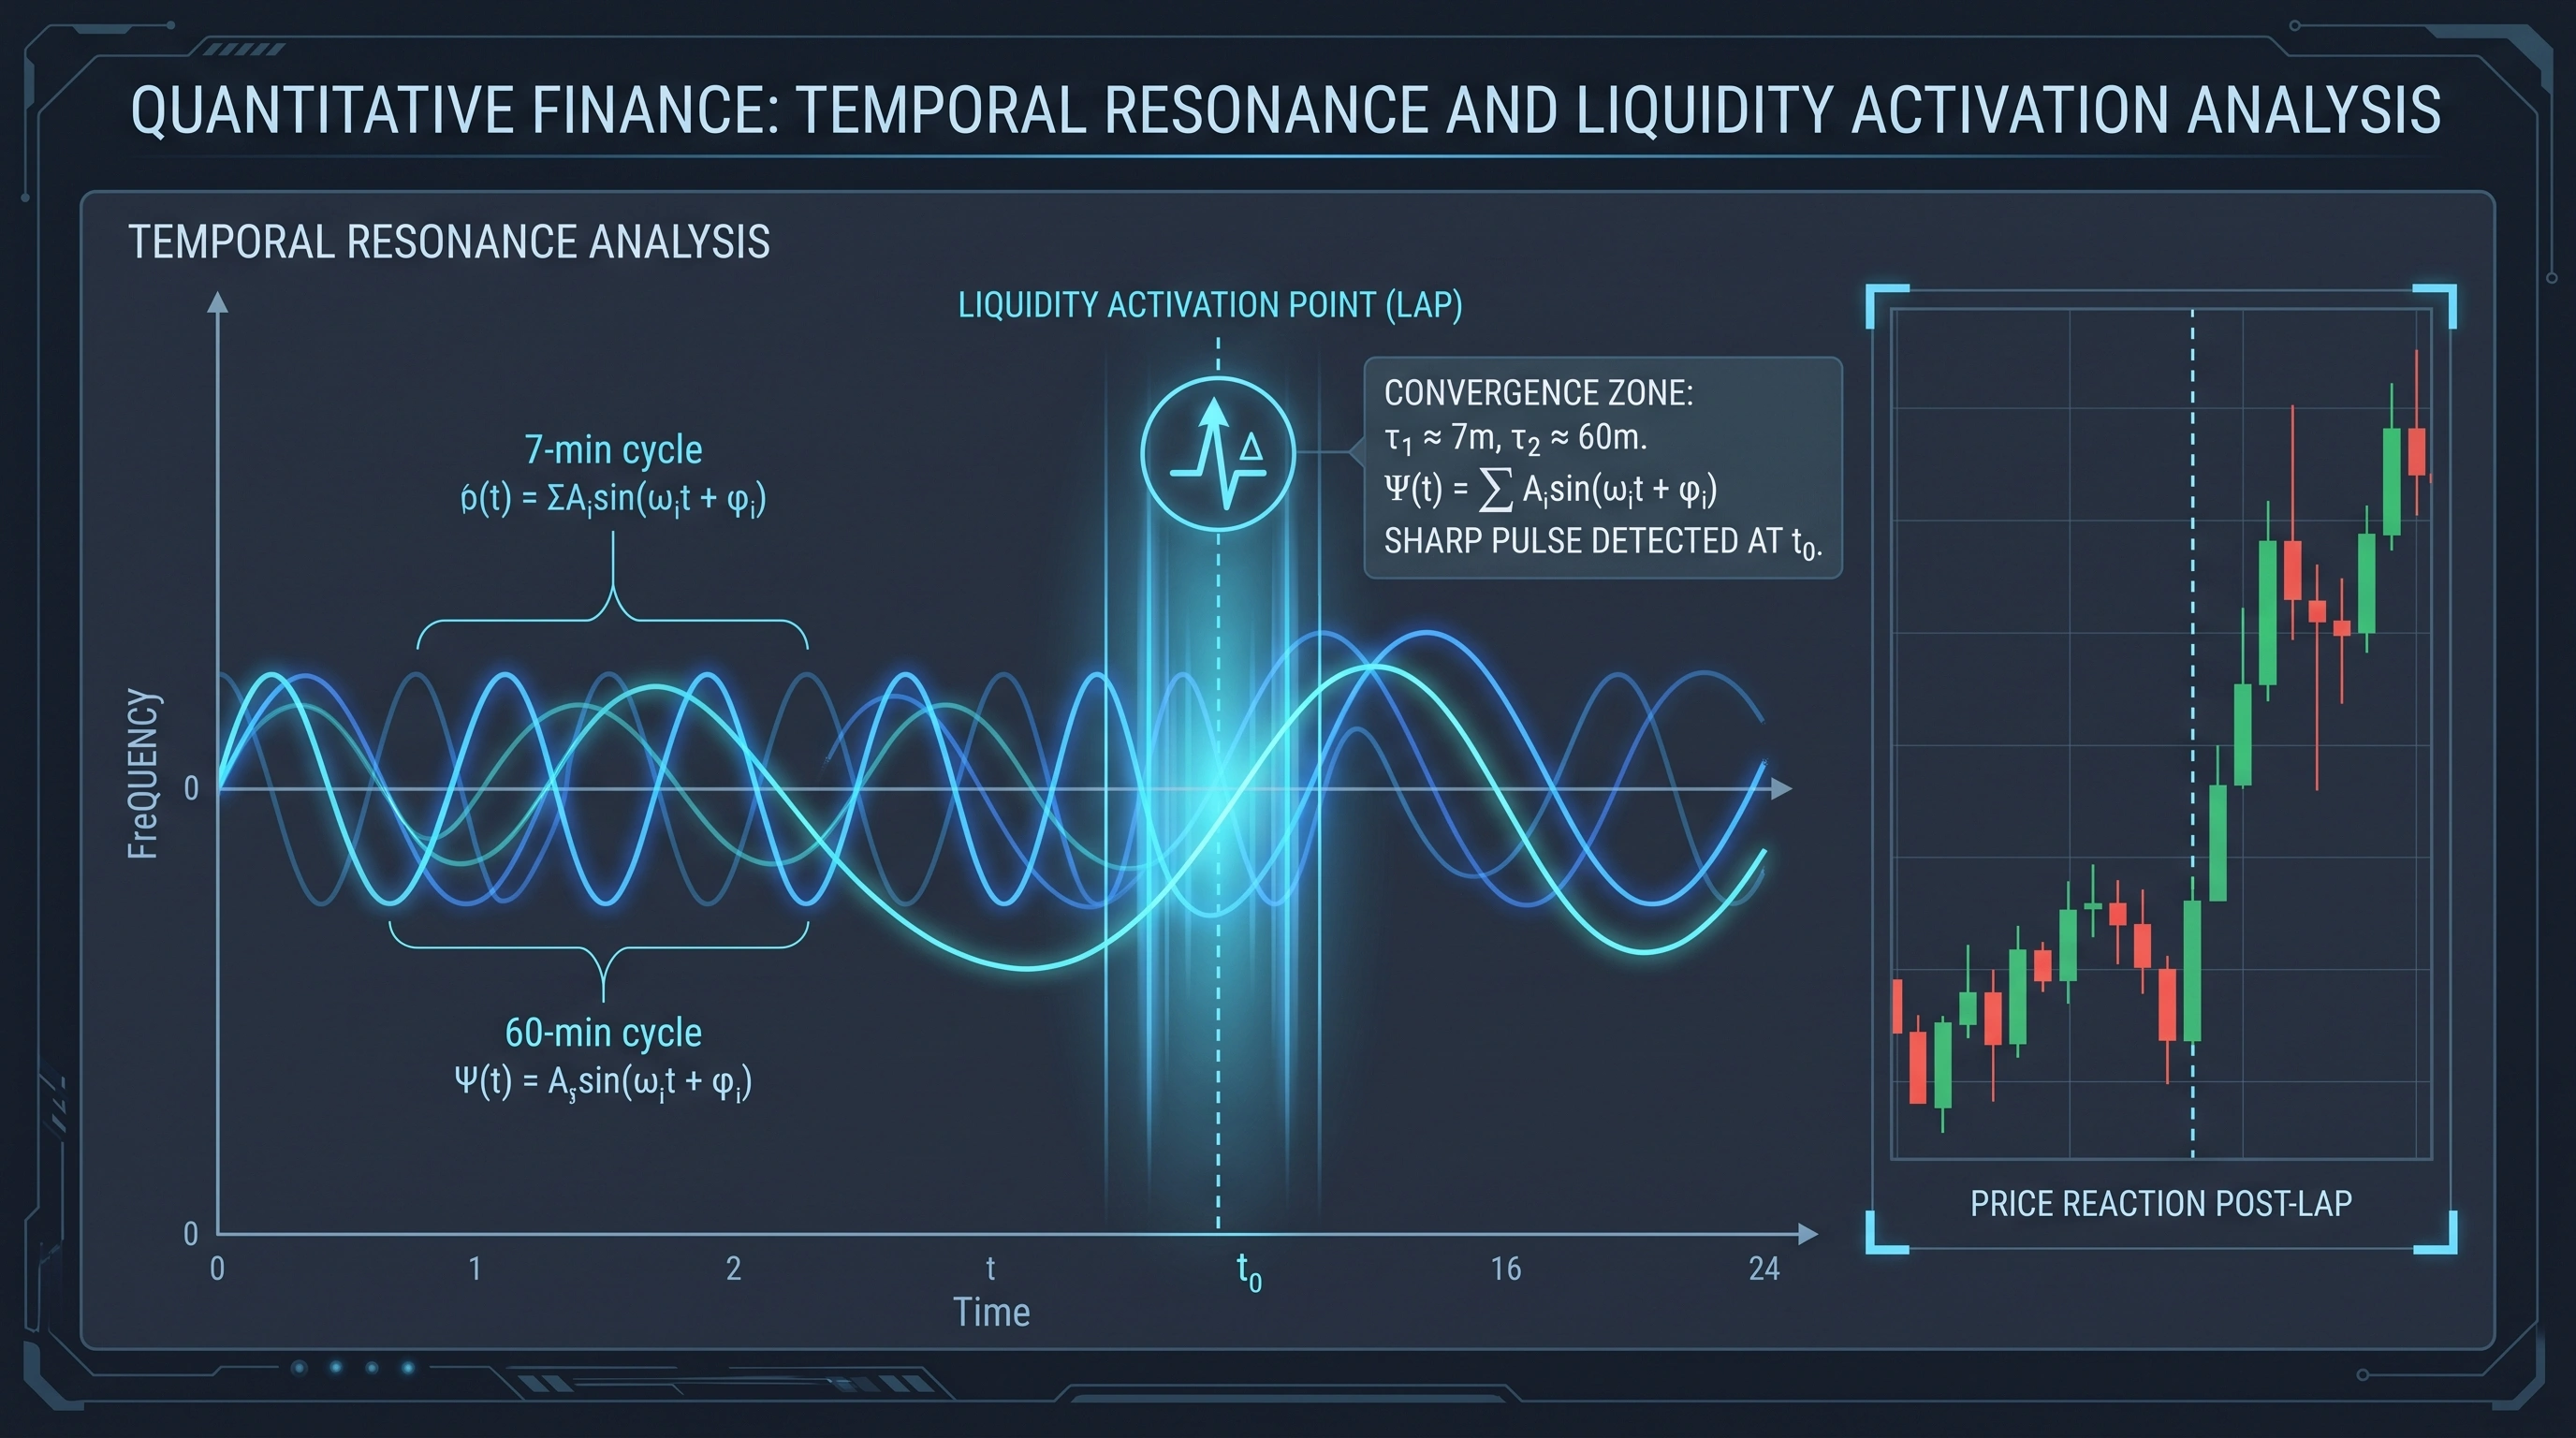
Lower-order timings (e.g., 7-minute LAPs) generate local impulses with an objectively smaller amplitude of price movement. Higher-order timings (e.g., 60-minute LAPs) establish a broader vector and macro-targets. The synchronization of timing spectra — when the activation moments of lower and higher-order cycles coincide — creates a temporal resonance, significantly increasing the amplitude and magnitude of the probable movement.
The iVISTscalp5 analytical framework for applying time cycles (LAP).
5. Convergence of Time Intervals (LAP Spectra)
Zones of convergence hold particular analytical significance — the formation of spectra where multiple unidirectional timings cluster within a narrow range. The superimposition of cycles of varying orders acts as a catalyst for volatility.
Nevertheless, it must be noted that a quantitative accumulation of timings does not negate the necessity for risk management: profit-taking must be executed in accordance with calculated LAP targets, without an unwarranted inflation of expectations.
6. Significance of the Timing’s Initial Price Level
The price level at which the beginning of a calculated LAP (or the first timing in a spectrum) is recorded often acquires the properties of a liquidity attraction zone. Following the execution of the primary impulse, a return of quotes to the starting mark is statistically probable. This retest is qualified as a distinct structural phase. Any trading decision during a retest must be based on an objective Price Action analysis within this zone, rather than being treated as an automatic signal for a secondary entry.
7. Filtering External Macroeconomic Factors
The chronology and behavioral execution of LAPs are subject to substantial influence from the external environment. The formation of historical extremes, prolonged consolidation phases (flat markets), the release of key macroeconomic statistics, and high-intensity price shocks are capable of deforming the standard cyclical model. Filtering signals while accounting for the market environment is strictly mandatory. The algorithmic generation of an LAP does not imply the mandatory practical execution of every signal.
Summary
The iVISTscalp5 indicator is a mathematical complex designed to formalize answers to three key questions:
Chronology: When is the potential activation of liquidity forecasted?
Vectorization: Which direction of price displacement holds the highest mathematical probability?
Amplitude: What is the operational range of movement embedded in the model, factoring in spectral synchronization?
Thus, the calculated timing serves as a locator of market attention. The final investment decision is formulated exclusively at the intersection of the algorithm’s temporal data and confirming price dynamics.
Rules for LAP Analysis and Trading in the VISTmany Methodology
A practical framework for studying LAPs, price context, and market timing.
These rules connect a forecast with its market context; they are a framework for observation and testing, not a promise of a trading result. Follow the linked VISTmany terminology for precise definitions of the core concepts.
1. Start with the Bigger Picture
Do not analyze each LAP in isolation. First, assess the active timings: their direction, expected movement, duration, and relative positions within the market’s Temporal Space.
A LAP is a forecast point for potential market activation, not an automatic instruction to enter a trade. The key is to observe how price interacts with a timing and with the broader temporal structure.
2. Consider the Direction of the LAP
BUY — the forecast direction is upward.
SELL — the forecast direction is downward.
Do not make a decision based only on the BUY or SELL label. Compare the LAP direction with the current price position, the daily range, and other active timings.
3. Consider the Daily High and Daily Low
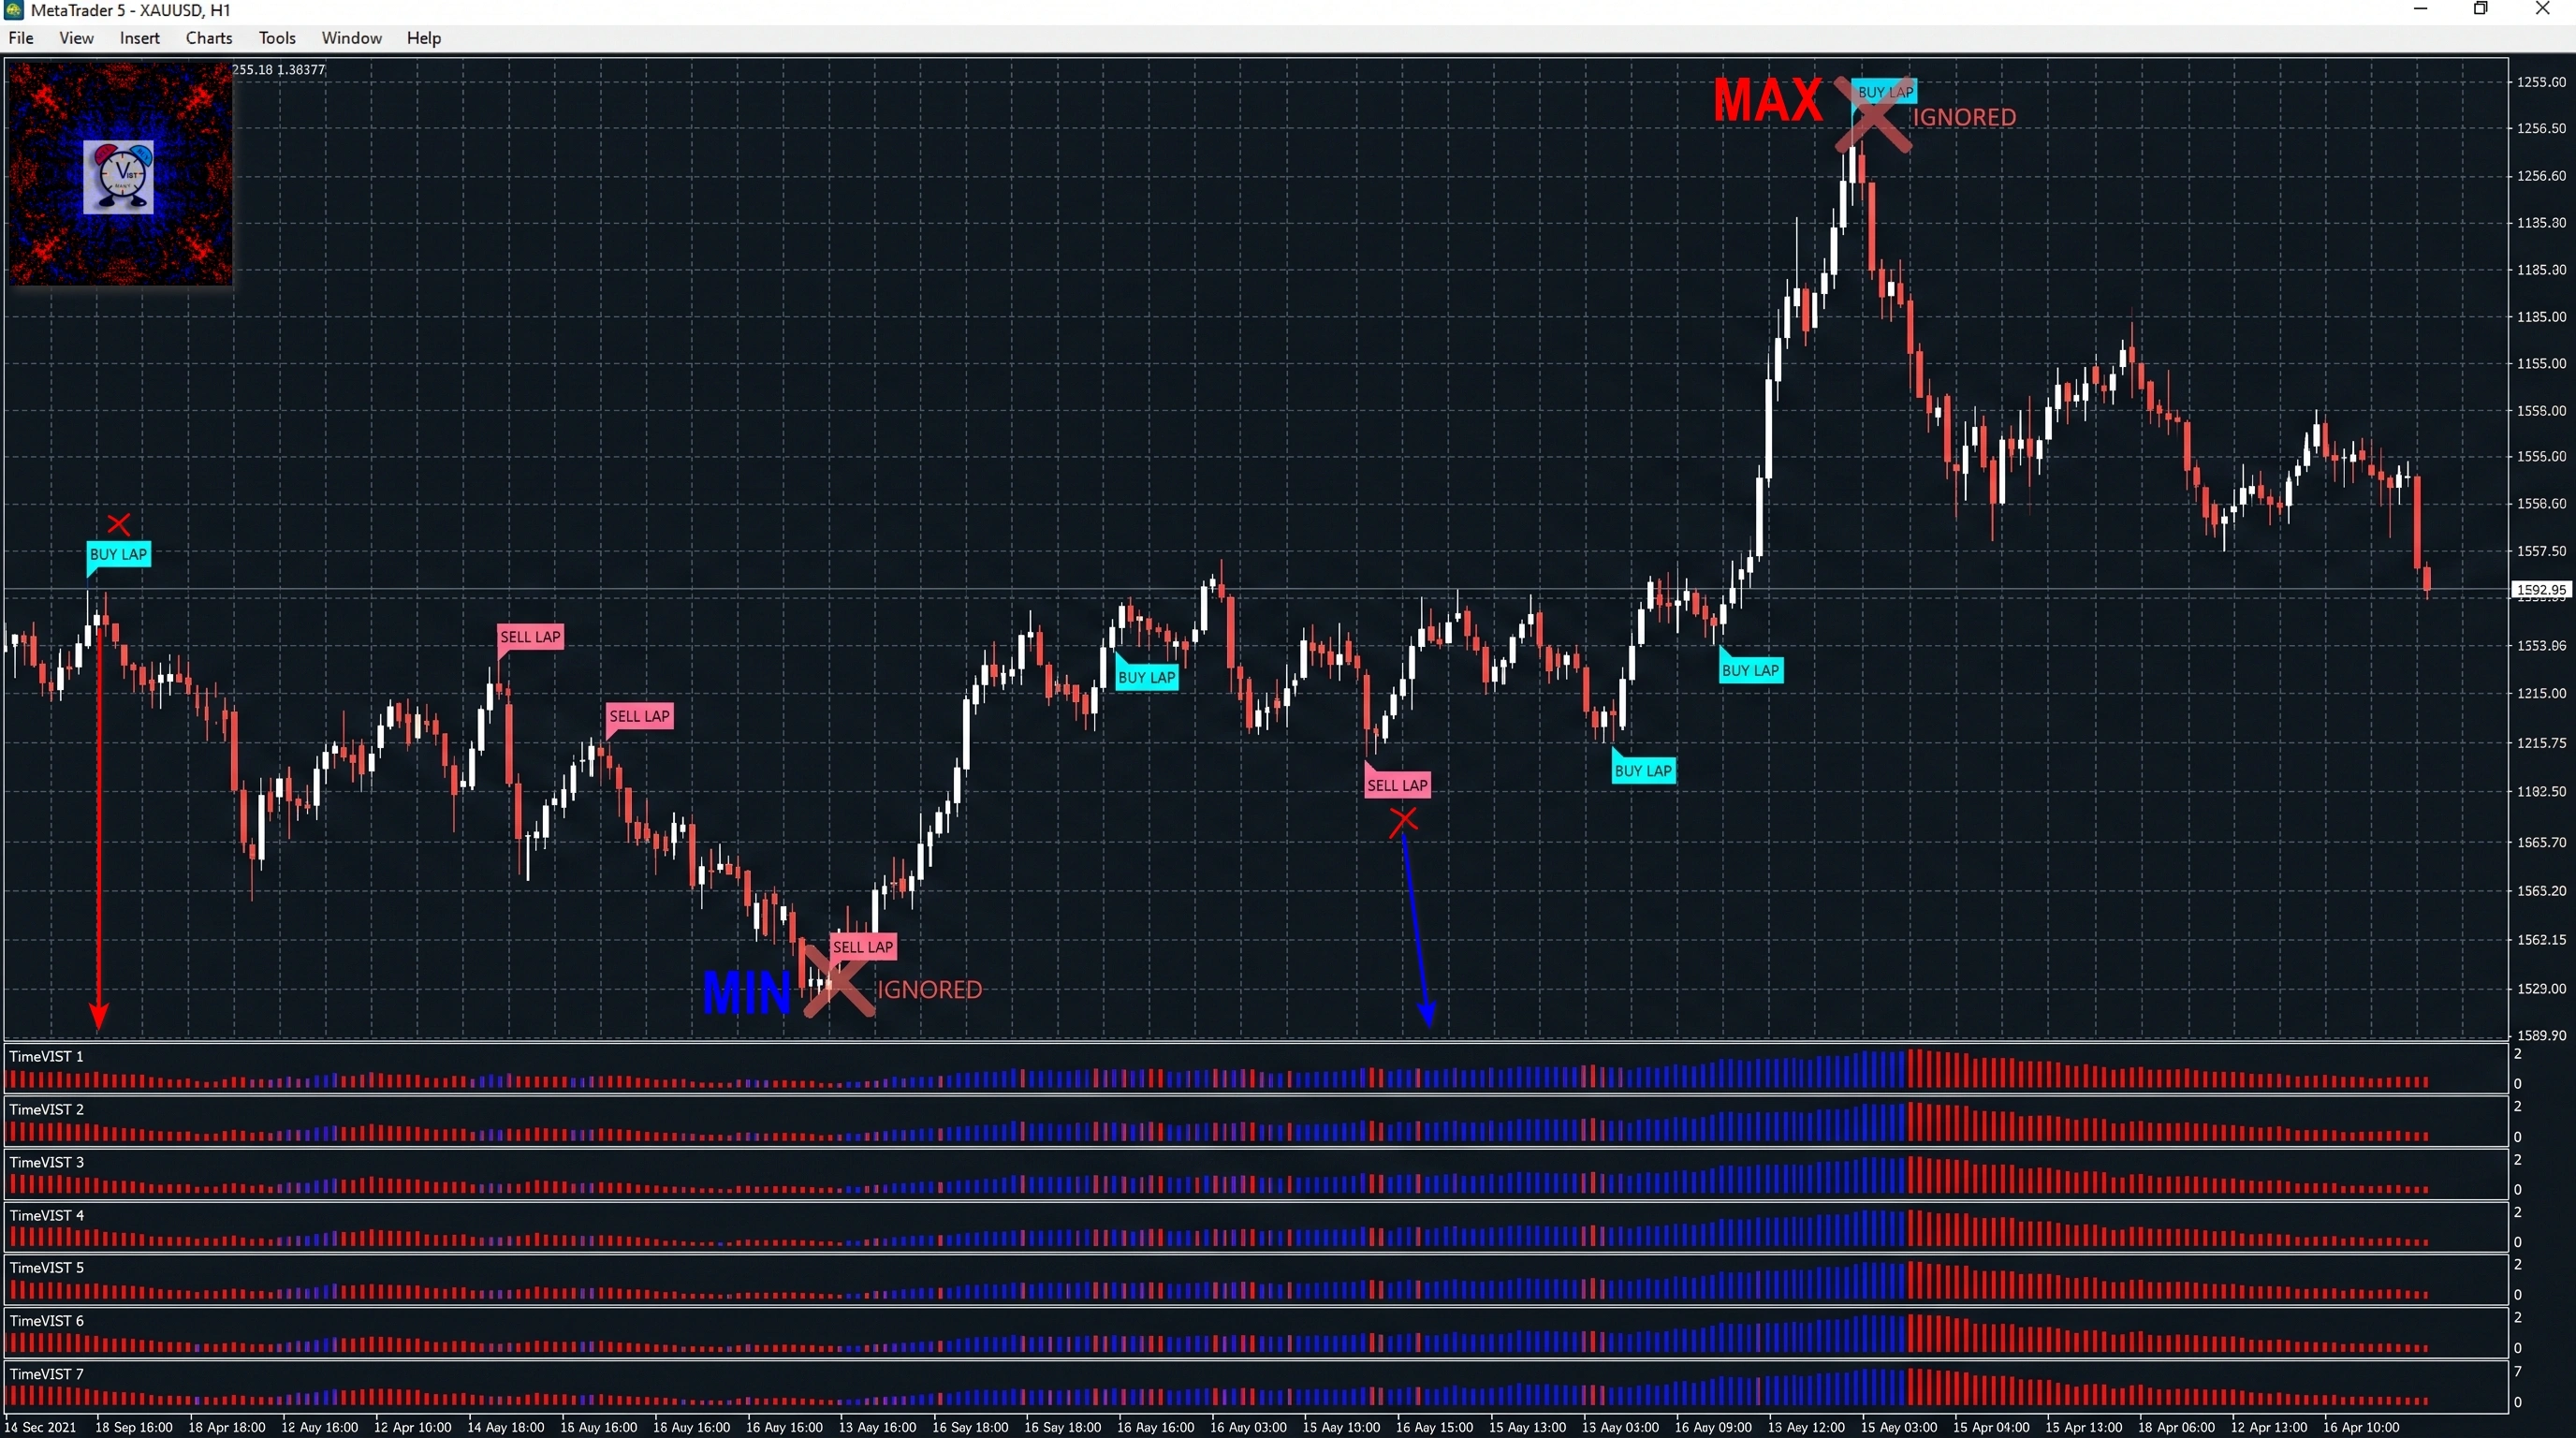
Do not buy at the daily high, even if a LAP BUY appears. Do not sell at the daily low, even if a LAP SELL appears.
First, assess where the price is positioned within the daily range and review the indicator’s price-structure features.
A LAP BUY at the daily high may coincide with profit-taking and a subsequent decline.
A LAP SELL at the daily low may coincide with the end of a decline and a possible rebound.
The direction of the timing matters, but the price location when the timing occurs matters just as much. Do not confuse the expected direction of a LAP with an unconditional entry signal.
4. Study the Price Test at the Start of a Timing
Pay attention to how price behaves when a LAP becomes active. After the initial movement, price may return to the timing’s starting price and then continue moving.
Study returns to the starting price of the first LAP in a spectrum particularly carefully. The glossary explains how time and price levels align in this analysis.
A sequence to observe:
LAP activation → return to the starting price → price reaction → possible continuation of the movement.
This is a scenario to investigate, not a sequence that every timing must follow. Test it using historical price data.
5. Compare Expected Movement with the Actual Result
Each LAP has an expected movement measured in points. Compare it with the movement price actually makes.
Study:
how closely the actual movement matches the expected movement;
how much of the movement has already occurred;
how much TimeLife remains;
how price behaves as the timing develops.
Do not evaluate a LAP only by whether price reaches the expected number of points. Time and the character of the movement also matter.
Observe the expected movement, elapsed time, and price response as a LAP develops.
6. Study Horizontal LAP Spectra
A horizontal spectrum is a group of closely positioned LAPs with the same duration and direction. Compare its structure with Temporal Density; the number of timings alone does not establish that a pattern is stronger.
Pay attention to:
the first LAP in the spectrum;
the middle LAPs;
the last LAP;
the price reaction to each LAP;
changes in the character of the movement as the spectrum develops.
Do not assume that a longer spectrum is automatically stronger than a shorter one. Study how the number and arrangement of timings relate to the actual price movement.
Do short LAPs join an already active, longer timing?
Does the movement strengthen when the timings align?
Does price behavior change when the timings diverge in time or direction?
The main objective is to see not just an individual signal, but the interaction between timings of different durations.
8. Compare Alignment and Divergence Between LAPs
When active LAPs point in the same direction, study how price reacts to their combined influence and how higher and lower timings relate.
When their directions differ, do not ignore the conflict. Observe which timings are active, how price develops, and whether the Temporal Space changes.
It is important to analyze not only the market’s state at a particular moment, but also the transitions between market states.
9. Consider the Trading Week of the Month
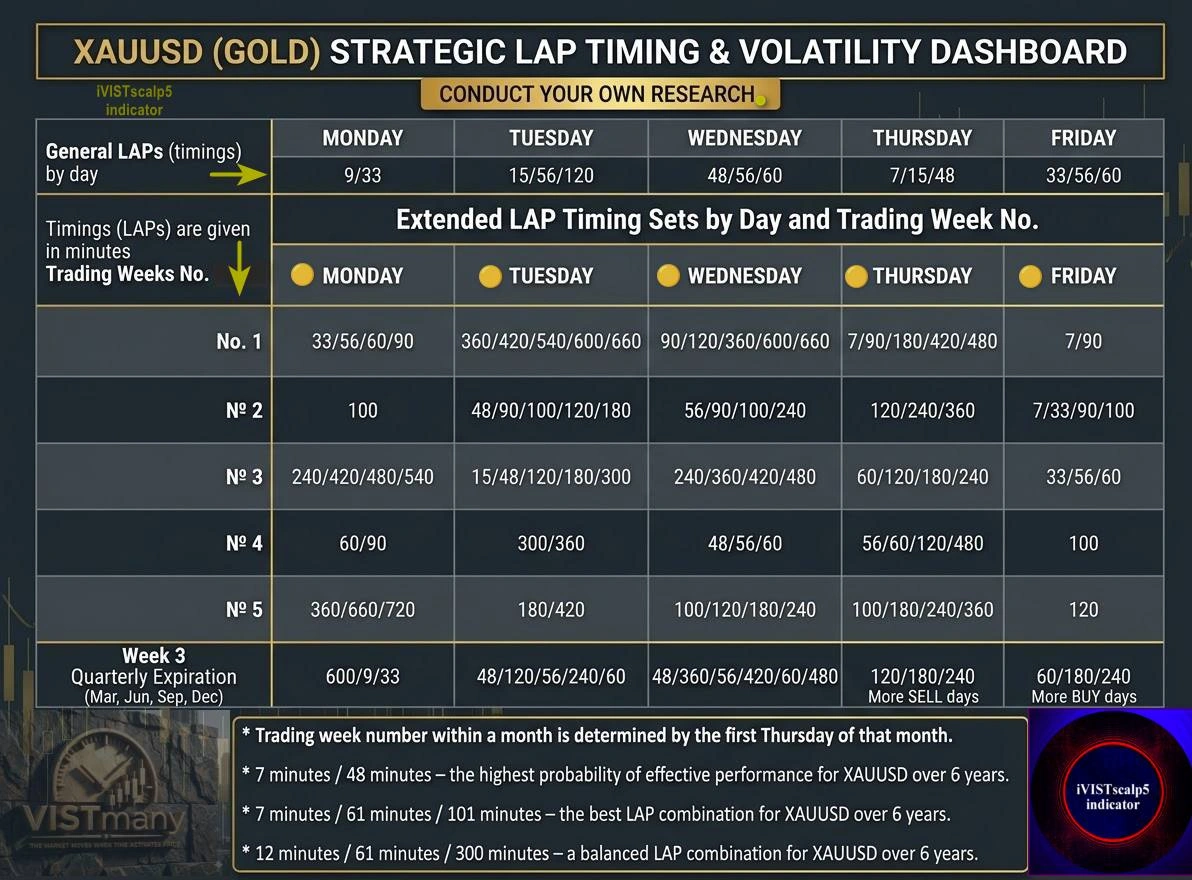
In the VISTmany methodology, the monthly trading-week numbering is based on Thursday: the first trading week includes the first Thursday of the month. Give particular attention to studying LAPs during the second and third trading weeks of the month. Compare this calendar context with the XAUUSD LAP calendar.
Week 1 — often requires greater attention to market noise.
Weeks 2 and 3 — the main priority for LAP research and trading.
Week 4 — account for possible distortions associated with the end of the month.
This is a research guideline, not a guarantee of results. The trading week provides context but does not replace analysis of LAP direction, price position, and spectra.
10. Track the Timing as It Develops
Consider TimeLife — the period during which a timing remains active.
Do not focus only on the moment a LAP appears. Observe how price behaves throughout its active period and how it interacts with other timings.
The end of TimeLife does not, by itself, mean that a reversal or continuation must occur. Study the actual price reaction.
11. Select Situations for Analysis Instead of Trading Every Signal
Not every LAP is suitable for entering a trade.
Before making a decision, consider several factors together:
LAP direction.
Price position relative to the daily high and daily low.
Price reaction at the start of the timing.
Expected movement in points.
The LAP’s position within a horizontal or vertical spectrum.
Alignment or divergence between active timing directions.
The trading week of the month.
The remaining TimeLife of the LAP.
The better you understand the context, the more informed your decision becomes. However, none of these factors guarantees a trade outcome.
12. Test Your Observations on Historical Price Data in MT5
Use the MetaTrader 5 Strategy Tester, described in the iVISTscalp5 indicator guide, to study LAP behavior on historical data.
Test:
how often price returns to the timing’s starting point;
how horizontal and vertical spectra develop;
how results depend on price position within the daily range;
how LAPs behave at daily highs and daily lows;
how Weeks 2 and 3 differ from Weeks 1 and 4;
how expected movement compares with actual movement.
Test your observations across different historical periods. Do not conclude that a pattern exists based on a few successful examples.
The purpose of research is to identify recurring features of price behavior, not to find explanations for results that are already known.
13. Maintain Discipline and Develop Your Analytical Skills
Follow a consistent plan. Record your observations, compare them with historical examples, and revisit situations in which your initial assessment was incorrect.
Do not change your rules after every individual trade, and do not look only for evidence that confirms your forecast.
Developing the ability to read LAPs requires systematic study of:
the market’s temporal structure;
price reactions to timing activation;
horizontal and vertical spectra;
the interaction between LAPs and the daily range;
differences between the trading weeks of the month.
The main principle of VISTmany: analyze not only the direction of movement, but also the time of its activation, the price position, and the interaction between timings. Explore the Research Journal for the broader research framework.
LAP provides a temporal context for studying market movement. The trader’s task is to learn to read this context, test observations against historical data, and make decisions according to predefined rules.
XAUUSD: The LAP Calendar — The Temporal Structure of Gold by Weekday and Trading Week
How to use VISTmany timings when trading gold
An analysis of historical XAUUSD quotes from 2020 to 2026 enabled VISTmany to organize temporal patterns in the gold market into a calendar of the most significant LAPs (Liquidity Activation Points). For a practical explanation of how to interpret LAPs, see the market timings guide.
The calendar combines two dimensions of market time: the day of the week and the trading-week number within the month. This makes it possible to examine timings not as isolated values, but as elements of a broader temporal market structure.
Why do the weekday and trading-week number matter?
The significance of a timing may depend on its calendar context. For this reason, VISTmany presents temporal patterns at several levels, from general LAP sets for each weekday to extended combinations for specific trading weeks.
This approach helps traders consider both shorter-term and longer-term temporal structures. The calendar also identifies quarterly expiration weeks in March, June, September, and December.
Within the VISTmany methodology, trading weeks are numbered according to the first Thursday of the month.
Three ways to work with LAPs
Calendar-based approach. Use the extended table to select timing sets according to the current weekday and trading-week number. This approach is intended for traders who prefer to account for the calendar structure in greater detail.
A universal balance of micro- and macro-timings. The 12 / 61 / 300-minute combination represents an average, balanced configuration that can be used every day without constantly changing settings according to the weekday or trading week. It combines different time scales and is designed for traders who prefer a consistent set of LAPs.
Selected timing combinations. The historical quote analysis highlights 7 / 48 minutes and 7 / 61 / 101 minutes as particularly notable combinations. They represent distinct findings from the study of XAUUSD temporal patterns and complement the calendar-based approach.
How to use the calendar in practice
The LAP calendar helps traders identify which time intervals to consider when analyzing the market on a particular trading day. You can work with the extended calendar sets or choose the balanced combination if you prefer to maintain consistent settings.
LAPs are temporal reference points, not standalone forecasts of price direction. Within the VISTmany approach, their purpose is to help traders focus on periods of potential market activity and examine price behavior in the corresponding temporal context.
The key idea: the gold market can be studied not only through price levels but also through the structure of time. The VISTmany LAP calendar brings daily and weekly patterns together in one framework, allowing traders to choose between detailed calendar-based analysis and a universal balance of micro- and macro-timings.
Temporal patterns and Liquidity Activation Points in the VISTmany approach to XAUUSD.
The findings are based on an analysis of historical XAUUSD quotes from 2020 to 2026. This material is intended for research and educational purposes and does not guarantee future price movements.
TLV: Which LAPs (Timings) to Ignore in Market Analysis
The informed trader is always one step ahead.
The iVISTscalp5 indicator calculates LAPs (Liquidity Activation Points) for any financial instrument in MetaTrader 5 up to a week in advance. This capability allows for the proactive study of potential movement activation moments, their projected direction, and their estimated scale in points.
However, the existence of a temporal forecast does not imply that every calculated timing must be utilized for an immediate trade entry.
A professional trader's primary skill is not merely spotting an LAP on the chart, but understanding when to engage with it, when to await a price reaction, and when it is safer to bypass a trading opportunity entirely.
Within the VISTmany methodology, timing designates a moment for market observation, not a guarantee of a unilateral, un-retracing movement. That is precisely why intelligent timing filtration is a critical component of analysis using the TLV (Time Language VISTmany) framework.
1. The Primary Rule: Do Not Trade Every LAP
The most common mistake novice traders make is perceiving a BUY signal as a mandatory purchase command, and a SELL as a mandatory short.
The market is vastly more complex and multifaceted. The exact same LAP can appear:
At the inception of a nascent impulse;
In the midst of an already active trend;
At exhaustion, following an anomalous rally or sell-off;
In close proximity to a counter-directional timing;
Within a horizontal or vertical spectrum.
In all these scenarios, the price reaction will be fundamentally different.
The TLV Rule: Contextual analysis first, price reaction second, and only then—the investment decision. Ignoring a timing in a trading sense means not utilizing it as an independent justification for entry within the current macrostructure, without necessarily removing it from the chart.
Filter LAPs by market context and price response rather than treating every timing as an entry command.
2. Respect Inertia: Filter SELLs Following a Strong Decline
Suppose the market has already covered a significant distance downward. The price has updated the daily low, the bearish impulse carries high inertia, and at this exact moment, the algorithm generates a new SELL LAP.
It seems logical to trade with the trend; however, this is exactly where the trap lies. Following a sharp decline, the market may form a false breakdown of the low, enter a deep correction, or initiate a reversal process. If the movement has already exhausted its calculated potential, a new SELL may appear too late.
What to verify prior to entry:
How far the price has already deviated from the starting structure.
Whether there are counter-directional BUY timings ahead in time.
Whether a spectrum of the opposite direction is forming.
How the price reacts to the nearest liquidity levels.
Even if the price makes another brief downward thrust after your entry, it does not validate the trade. The final short impulse is often the ultimate stop-hunting phase before a reversal.
3. The Mirror Rule: Filter BUYs Following a Strong Rally
The situation is identical: the price has updated the daily high on a powerful impulse, and a new BUY LAP emerges. The timing's direction aligns with the trend, but the potential for a safe entry may already be depleted. Buying at historical extremes based solely on an isolated timing is an unjustified risk. First, examine whether the price sustains the structure after testing the underlying p(p) level, or if the momentum is beginning to fade.
4. Daily Extremes — High Danger Zones
The daily high and low do not guarantee a reversal, but they demand a multiplicative increase in analytical attention.
Do not automatically buy at the high upon seeing a BUY signal. Do not automatically sell at the low upon a SELL signal. In TLV, the trader's objective is not to guess the top or bottom, but to determine whether the price possesses sufficient energy to break the extreme exactly at the moment of LAP activation.
Daily extremes are context for analysis, not automatic reversal signals.
5. Temporal Horizon: Look Ahead
This is one of the foundational filtration principles in TLV. Do not isolate the current LAP—study the timing structure to the right of the chart.
The current SELL may yield only a brief reaction if the algorithm has calculated a powerful BUY structure just a few minutes later. Counter-directional timings act as natural amplitude limiters.
Pay particularly close attention to the emergence of Momentum Clusters, vertical spectra, and intersections of timings from different cycles. The narrower the distance between opposing LAPs, the more rigorous your filtration must be.
6. The Illusion of Length: A Long Spectrum Does Not Equal a Strong Result
A massive cluster of LAPs of the same timeframe on the chart creates a visual impression of high reliability. However, density alone does not guarantee the full execution of the expected movement.
The VISTmany quantitative research report on XAUUSD M1 spanning 2020–2026 establishes that long horizontal spectra more frequently reflect a prolonged phase of structural formation (accumulation).
The Amplitude Rule: To generate a strong, unilateral movement, it is not the length of the horizontal spectrum that matters, but vertical synchronization. The lower the timing (e.g., 7 minutes), the smaller its embedded movement amplitude. True critical energy and a multiplicative amplitude increase are achieved only when there is an overlap (synchronization) of spectra from both lower and higher timings at a single temporal coordinate.
Compare the structure, duration, and synchronization of LAP spectra before assessing movement potential.
7. Filter Macro and Micro Vector Divergences
In TLV, understanding the hierarchy of cycles is vital. If a short BUY LAP emerges against the backdrop of an active, dominant higher-timeframe structure directed downwards, a temporal conflict arises.
Divergence does not imply the automatic failure of the lower timing, but according to VISTmany research, such trades are subject to a more complex price trajectory, higher adverse excursion (drawdown), and reduced directional stability. The amplitude of the lower timing will be artificially suppressed by the pressure of the higher cycle. Skipping such trades in the absence of solid confirmation is a hallmark of professionalism.
8. News Events Break Standard Cycles
Key macroeconomic releases (FOMC, CPI, NFP) distort the market space. If an LAP coincides temporally with news events, the price reaction can be chaotic, bidirectional, or delayed. The news does not render the LAP erroneous; rather, it alters the aggregate state of the market in which the algorithm is stress-tested. During these periods, trading requires surgical caution.
9. TimeLife Expiration is Not a Reversal Signal
TimeLife is the active lifespan of a timing. The expiration of this interval does not signify that the market is obligated to reverse immediately. VISTmany data does not corroborate TimeLife expiration as a standalone signal for initiating counter-trend positions. Evaluate only the actual price retention and active spectra ahead.
10. Adverse Price Movement (Invalidation)
If the price has moved against the LAP's direction by a distance comparable to the timing's own calculated range, the scenario requires reassessment.
Based on the XAUUSD M1 dataset, a complete price recovery and target achievement following a deep adverse excursion within the remaining TimeLife is observed in only 10–15% of cases.
Do not average down losing positions hoping for temporal magic. The deeper the market has moved against the timing, the lower the probability of the primary scenario materializing.
11. Temporal Void is Not a Forecast
The absence of new LAPs on the chart (a void) indicates neither a reversal nor a trend continuation. Research proves that the price direction during moments of temporal “vacuum” cannot be utilized as a predictable variable. Rely solely on the still-active TimeLife periods of preceding structures.
12. Days of the Week: Account For Them, But Do Not Absolutize
Within the VISTmany project, the influence of the days of the week and weeks of the month on LAP volatility (particularly the 2nd and 3rd trading weeks) has been proven. However, the day of the week is not a universal prohibition on trading. Incorporate the calendar context, but priority always remains with the actual price structure.
13. The Power of Start Price
Following timing activation, the price returns to its inception level—the Start Price—with a 71–81% probability (depending on the structure type). This is a critical zone of liquid attraction.
But remember: a return to the Start Price is a cue for meticulous reaction analysis (retest), not an imperative for automatic order placement.
14. The Practical TLV Checklist: When It Is Better to Stay Out
Ask yourself three questions before opening a position:
Context: Has the price already exhausted its momentum? Is it a BUY at the peak? A SELL at the bottom?
Ahead: Is there an opposing LAP nearby? Is there vertical synchronization working against me?
Reaction: Has the price confirmed the forecast? Is the micro-impulse aligned with the macro-structure?
15. Verifying Rules in MetaTrader 5
The iVISTscalp5 architecture allows for calculating timings a week in advance. Utilize the Strategy Tester in MT5 to verify on historical data (without curve-fitting) how filtration protects your deposit.
The principal question during testing: does this filter enhance the final quality of scenario selection, accounting for spreads and slippage?
Conclusion. Strong Analysis Begins with the Right Rejection.
In the VISTmany philosophy, your objective is not to trade the maximum number of timings. Your objective is to extract profit from temporal anomalies. The algorithm highlights the moment. Your comprehension of the price context and your discipline accomplish the rest.
Not every timing should be traded. Sometimes the most profitable trade is the one you rightfully ignored.
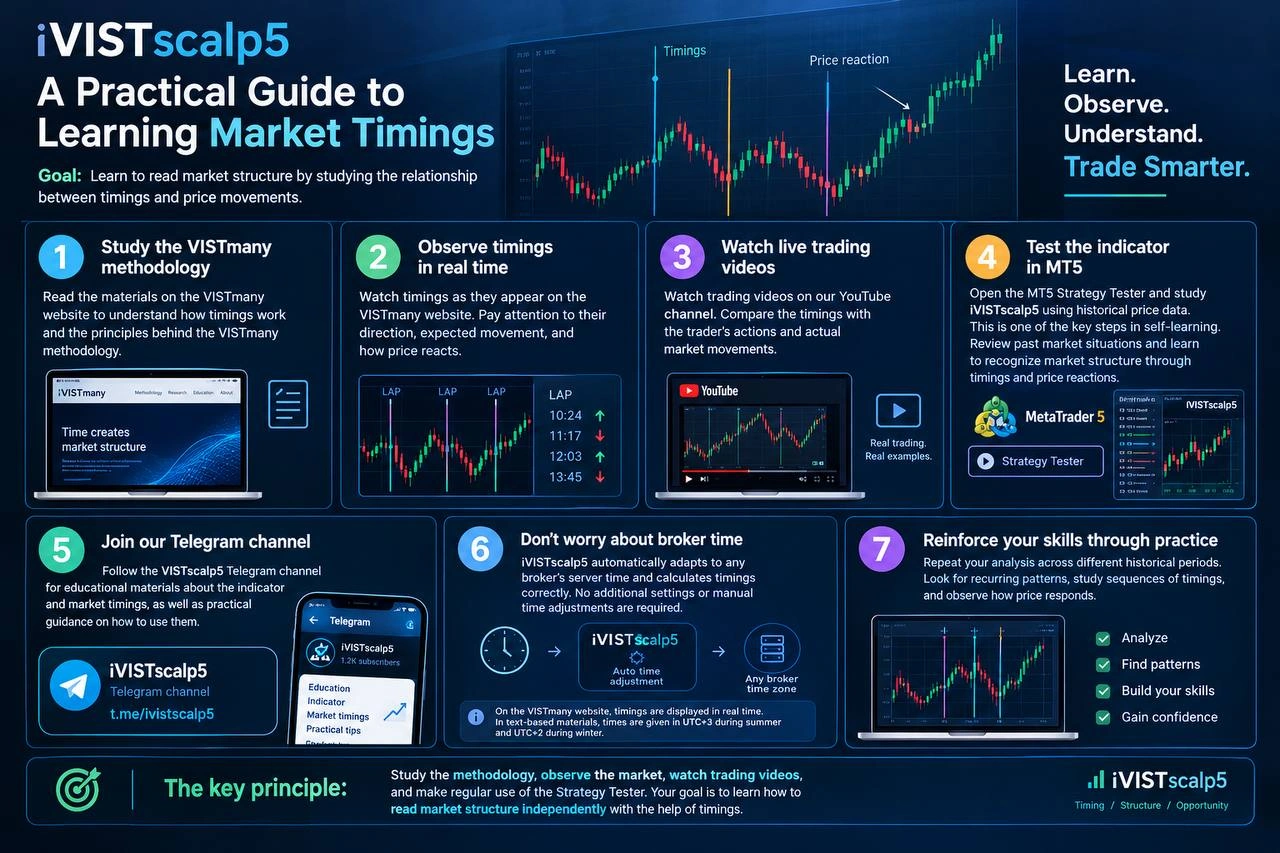
Watch timings as they appear in VISTLAB. Pay attention to their direction, expected movement, and how price reacts.
Step 3. Watch live trading videos
Watch trading videos on our YouTube channel. Compare the timings with the trader’s actions and actual market movements.
Step 4. Test the indicator in MT5
Open the MT5 Strategy Tester and study iVISTscalp5 using historical price data. The indicator guide explains its features; the FAQ answers practical questions. Review past market situations and learn to recognize market structure through timings and price reactions.
To view the indicator on the MetaTrader 5 Market, visit iVISTscalp5 on MQL5.
Step 5. Join our Telegram channel
Follow the iVISTscalp5 Telegram channel for educational materials about the indicator and market timings, as well as practical guidance on how to use them.
Step 6. Don’t worry about broker time
iVISTscalp5 automatically adapts to any broker’s server time and calculates timings correctly. No additional settings or manual time adjustments are required.
On the VISTmany website, timings are displayed in real time. In text-based materials, times are given in UTC+3 during summer and UTC+2 during winter.
Step 7. Reinforce your skills through practice
Repeat your analysis across different historical periods. Look for recurring patterns, study sequences of timings, and observe how price responds.
The key principle: Study the methodology, observe the market, watch trading videos, and make regular use of the Strategy Tester. Your goal is to learn how to read market structure independently with the help of timings.
VISTmany: A Complete Guide to LAP Spectra. How to Read Horizontal and Vertical Timings
If you are already familiar with the iVISTscalp5 indicator, you know what an LAP (Liquidity Activation Point) is—a calculated point in time indicating a high probability of a liquidity surge and the formation of a directional price movement. Review the formal definition of Temporal Spectrum in VISTmany Terminology or continue to the research on multi-spectral analysis.
However, the core scientific concept of the VISTmany laboratory states: market time is not merely a collection of isolated signals; it is an independent Temporal Space with its own architecture. An isolated timing is merely a spark. The true market structure and the moments demanding the trader's maximum attention are hidden within the spectra—the clusters and intersections of these timings.
In this article, we will explain in simple terms what horizontal and vertical LAP spectra are, how micro- and macro-timings differ, and how to apply this knowledge for professional market analysis.
The Fundamental Law: Micro- and Macro-Timings
To understand spectra, one must grasp the principle of amplitude proportionality. In our research, we utilize various time cycles:
Micro-timings (lower cycles, e.g., 7–15 minutes): This is the “pulse” of the market. They appear frequently and are accompanied by local, short-term impulses. Their embedded movement amplitude (expected points) is objectively small. They are ideal for the detailed study of price microstructure in the moment.
Macro-timings (higher cycles, e.g., 60 minutes and above): This is the “deep breath” of the market. They form the global vector and macro-targets. Their potential amplitude is significantly higher.
The Core Rule: A lower timing that contradicts a higher timing will be suppressed. If a 7-minute cycle indicates BUY while a 60-minute cycle is in an active SELL phase, the upward amplitude will be artificially compressed. True directional strength is born only when the cycles are aligned.
Horizontal Spectra: The Energy Accumulation Phase
What is it?
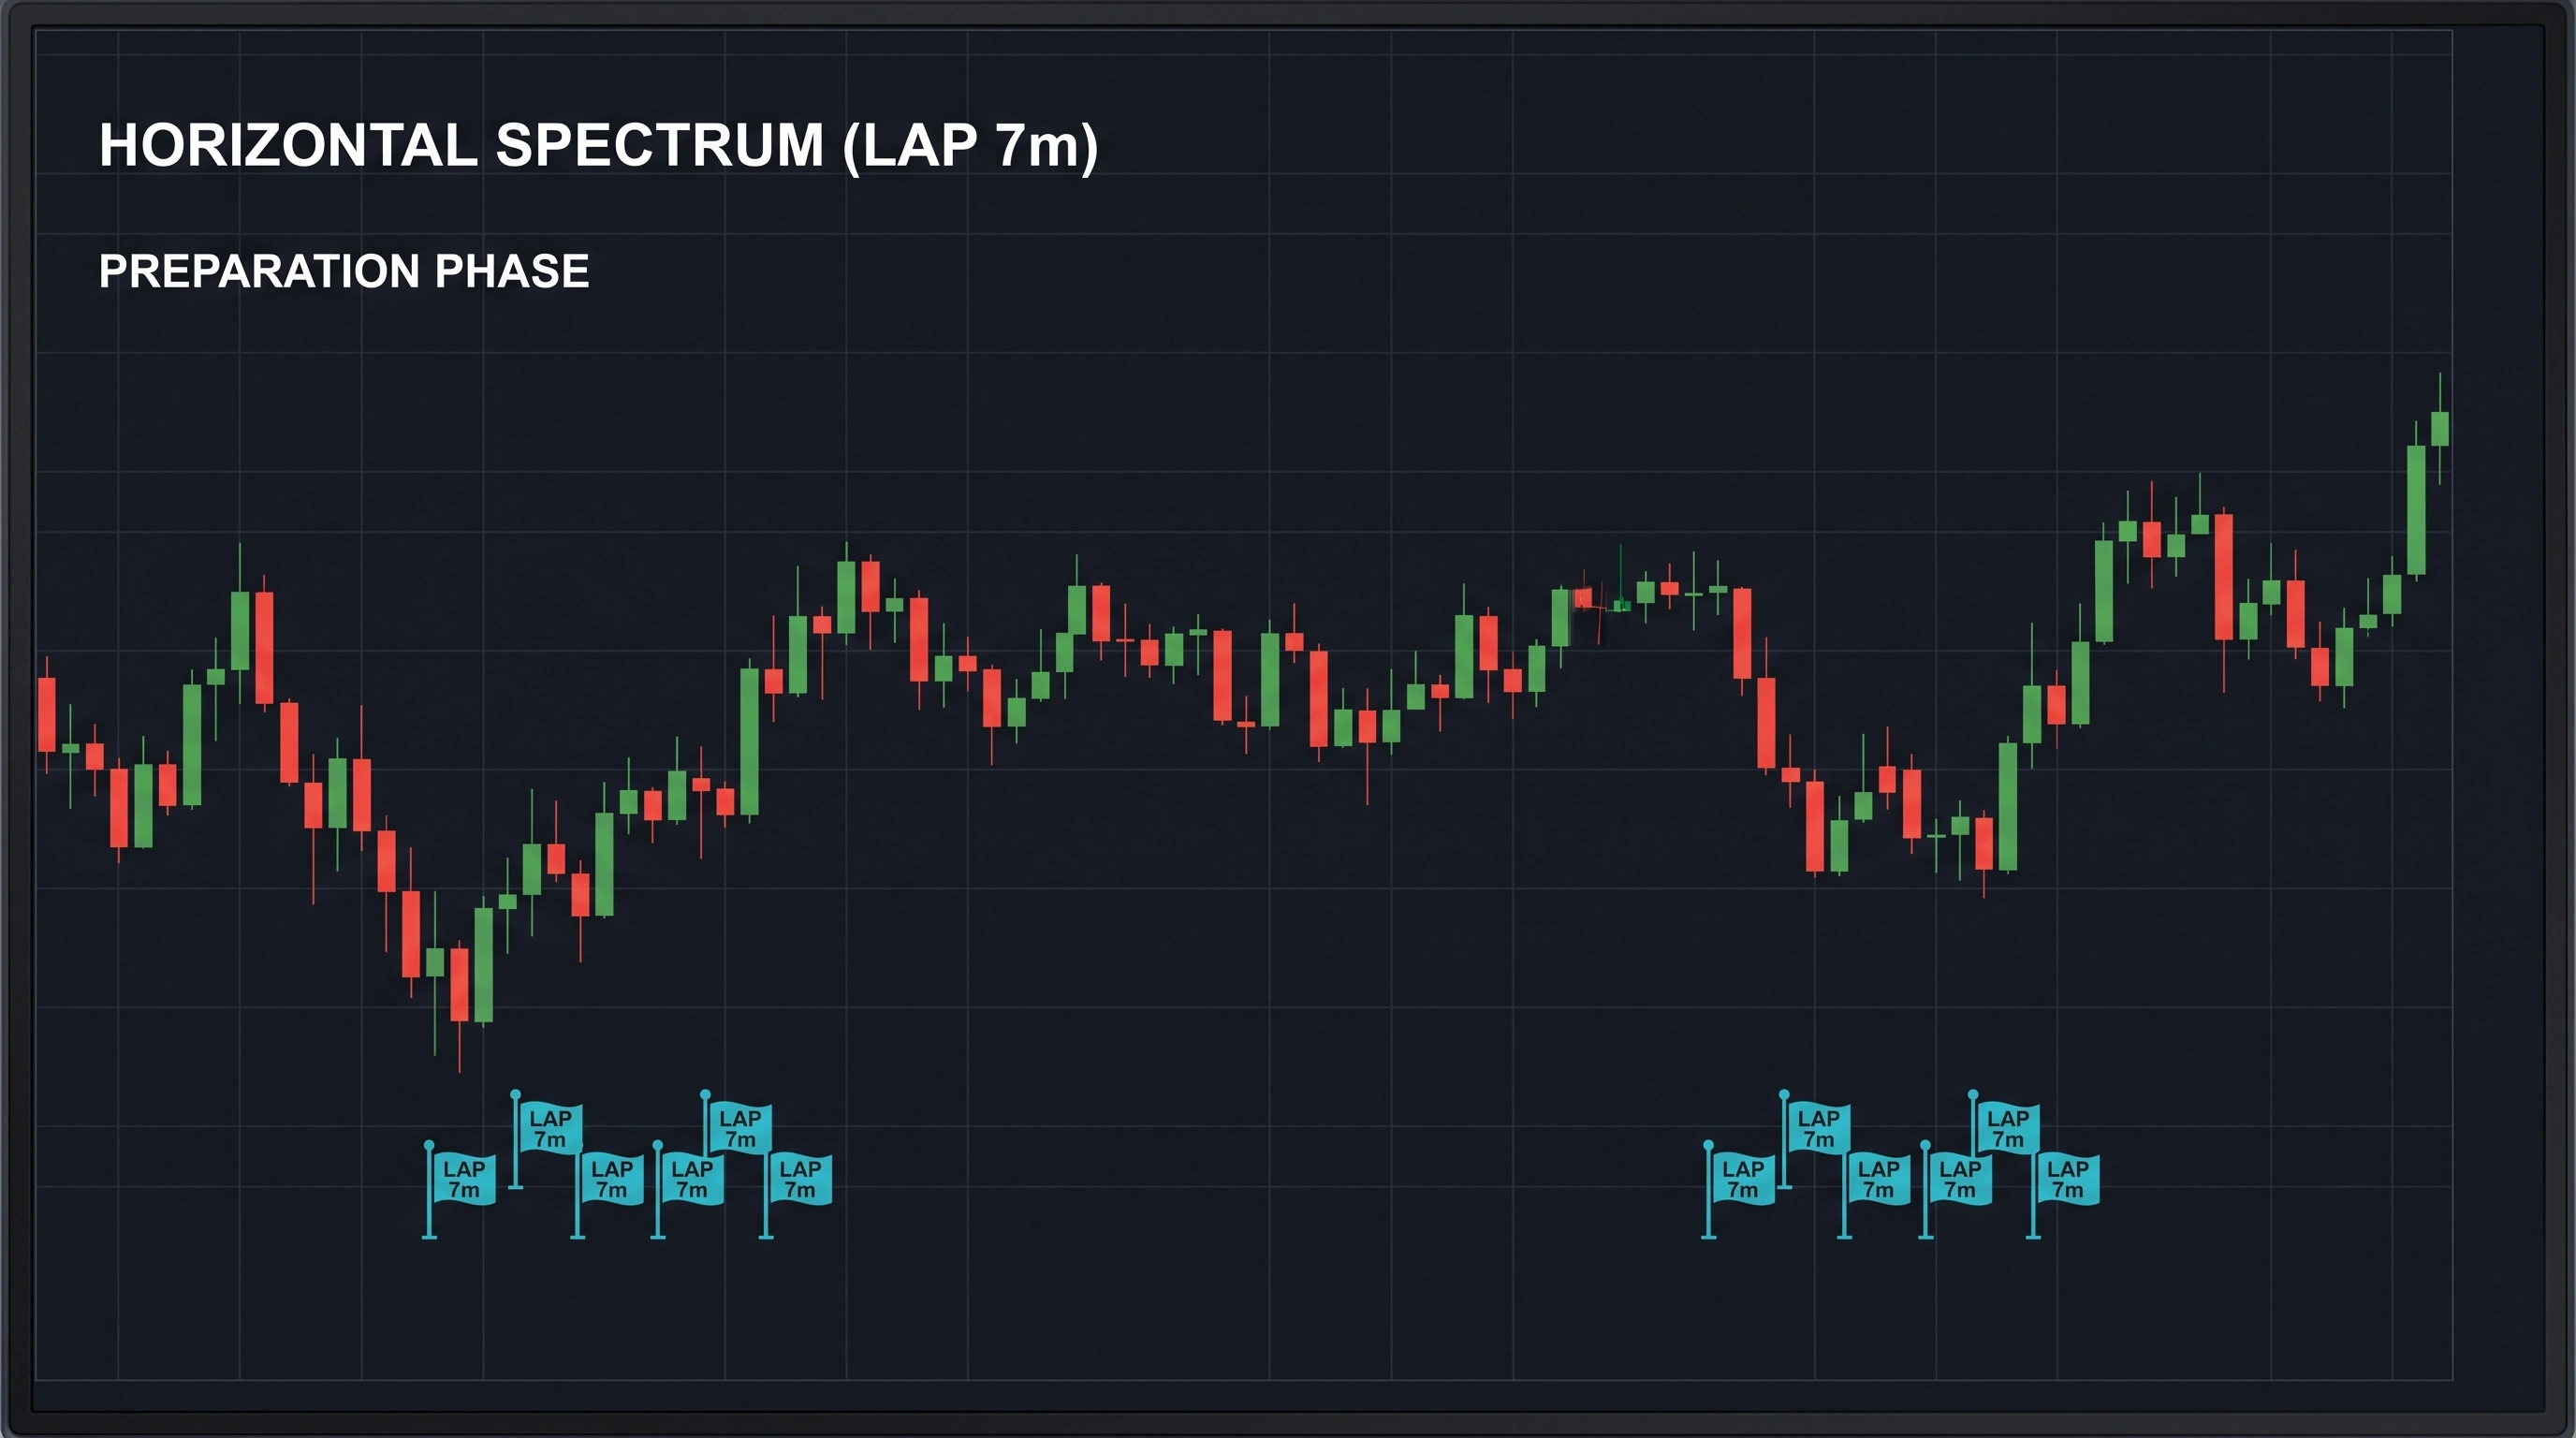
A horizontal spectrum occurs when a long, dense chain of timings of the same or similar orders aligns sequentially along the time axis.
In VISTmany's scientific publications, this process is described through the Temporal Density Theory, which proves that the concentration of timings is more important than their isolated occurrence.
A horizontal spectrum: closely sequenced timings forming a zone for focused observation.
In simple terms
Imagine winding up a spring mechanism. Every new LAP within a horizontal spectrum is another turn of the key. Energy accumulates, density increases, and liquidity gathers into a single pool.
How to apply this in practice: Mistakes and Rules
The Illusion of Reliability: A common mistake is to assume that if 10 consecutive BUY signals appear on the chart, the price is obligated to make an immediate strong surge.
The Reality: A long horizontal spectrum is an indicator of preparation. The market is accumulating energy. Very often, during the formation of a horizontal spectrum, the price is trapped in a flat (ranging) market or exhibits deceptive movements.
Your Action: Observe. A horizontal spectrum tells the trader: “Attention, a major movement is brewing here; study the price structure, but do not take hasty actions.”
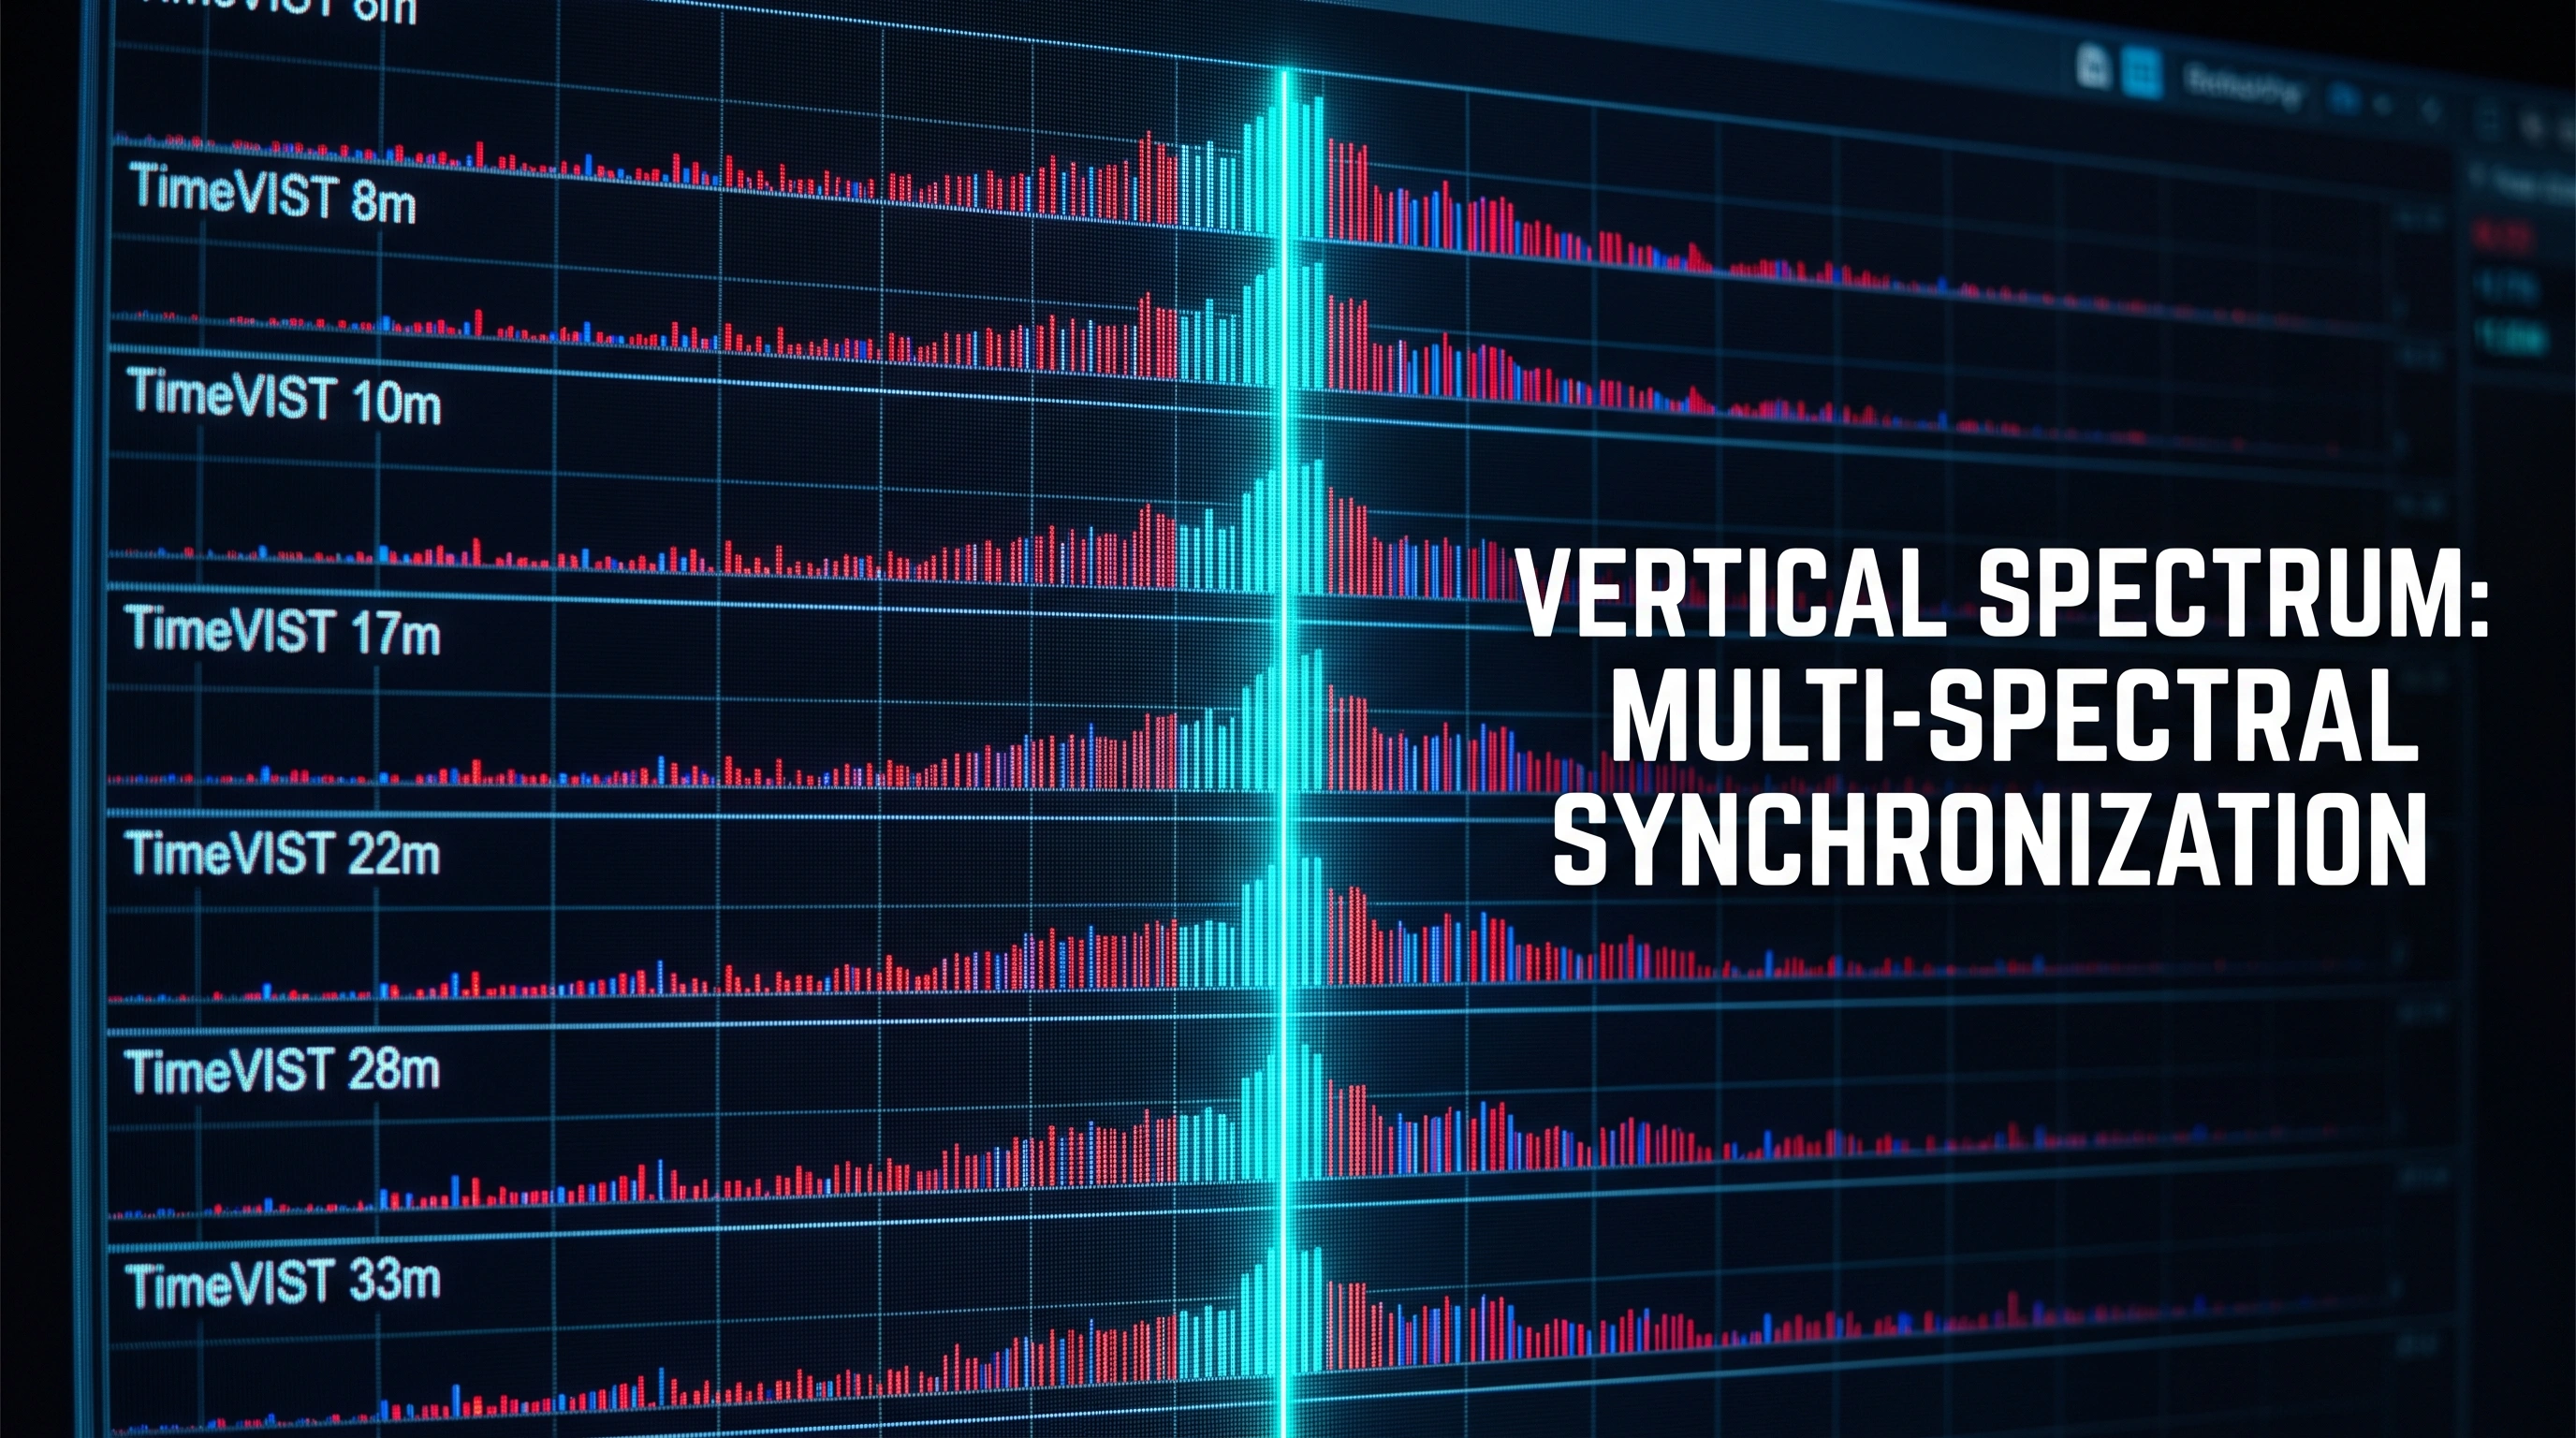
Vertical Spectra: Temporal Resonance and the TimeVIST Indicator
What is it?
A vertical spectrum (or Multi-Spectral Temporal Synchronization) is a point of mathematical harmony. It is the exact moment when the activation times of multiple timeframes (both micro and macro) coincide.
In VISTmany research, this phenomenon is called The Temporal Resonance Law. It explains how independent temporal structures synchronize to multiplicatively amplify market liquidity.
A vertical spectrum: activation times from multiple temporal cycles aligning at one point.
In simple terms
Imagine several gears of different sizes. Normally, they rotate at varying speeds. But once in a while, their teeth align perfectly. At this precise moment, the mechanism can transmit maximum impulse. A vertical spectrum is a laser beam concentrated from dozens of ordinary light bulbs.
Toolset: iVISTscalp5 and TimeVIST
You can fully conduct analysis, study market structure, and work with timings using the iVISTscalp5 indicator, which is already available on the MQL5 Market. However, for a more convenient and intuitive visualization of horizontal and vertical spectra, we have developed a specialized indicator—TimeVIST (which will also appear on MQL5 soon).
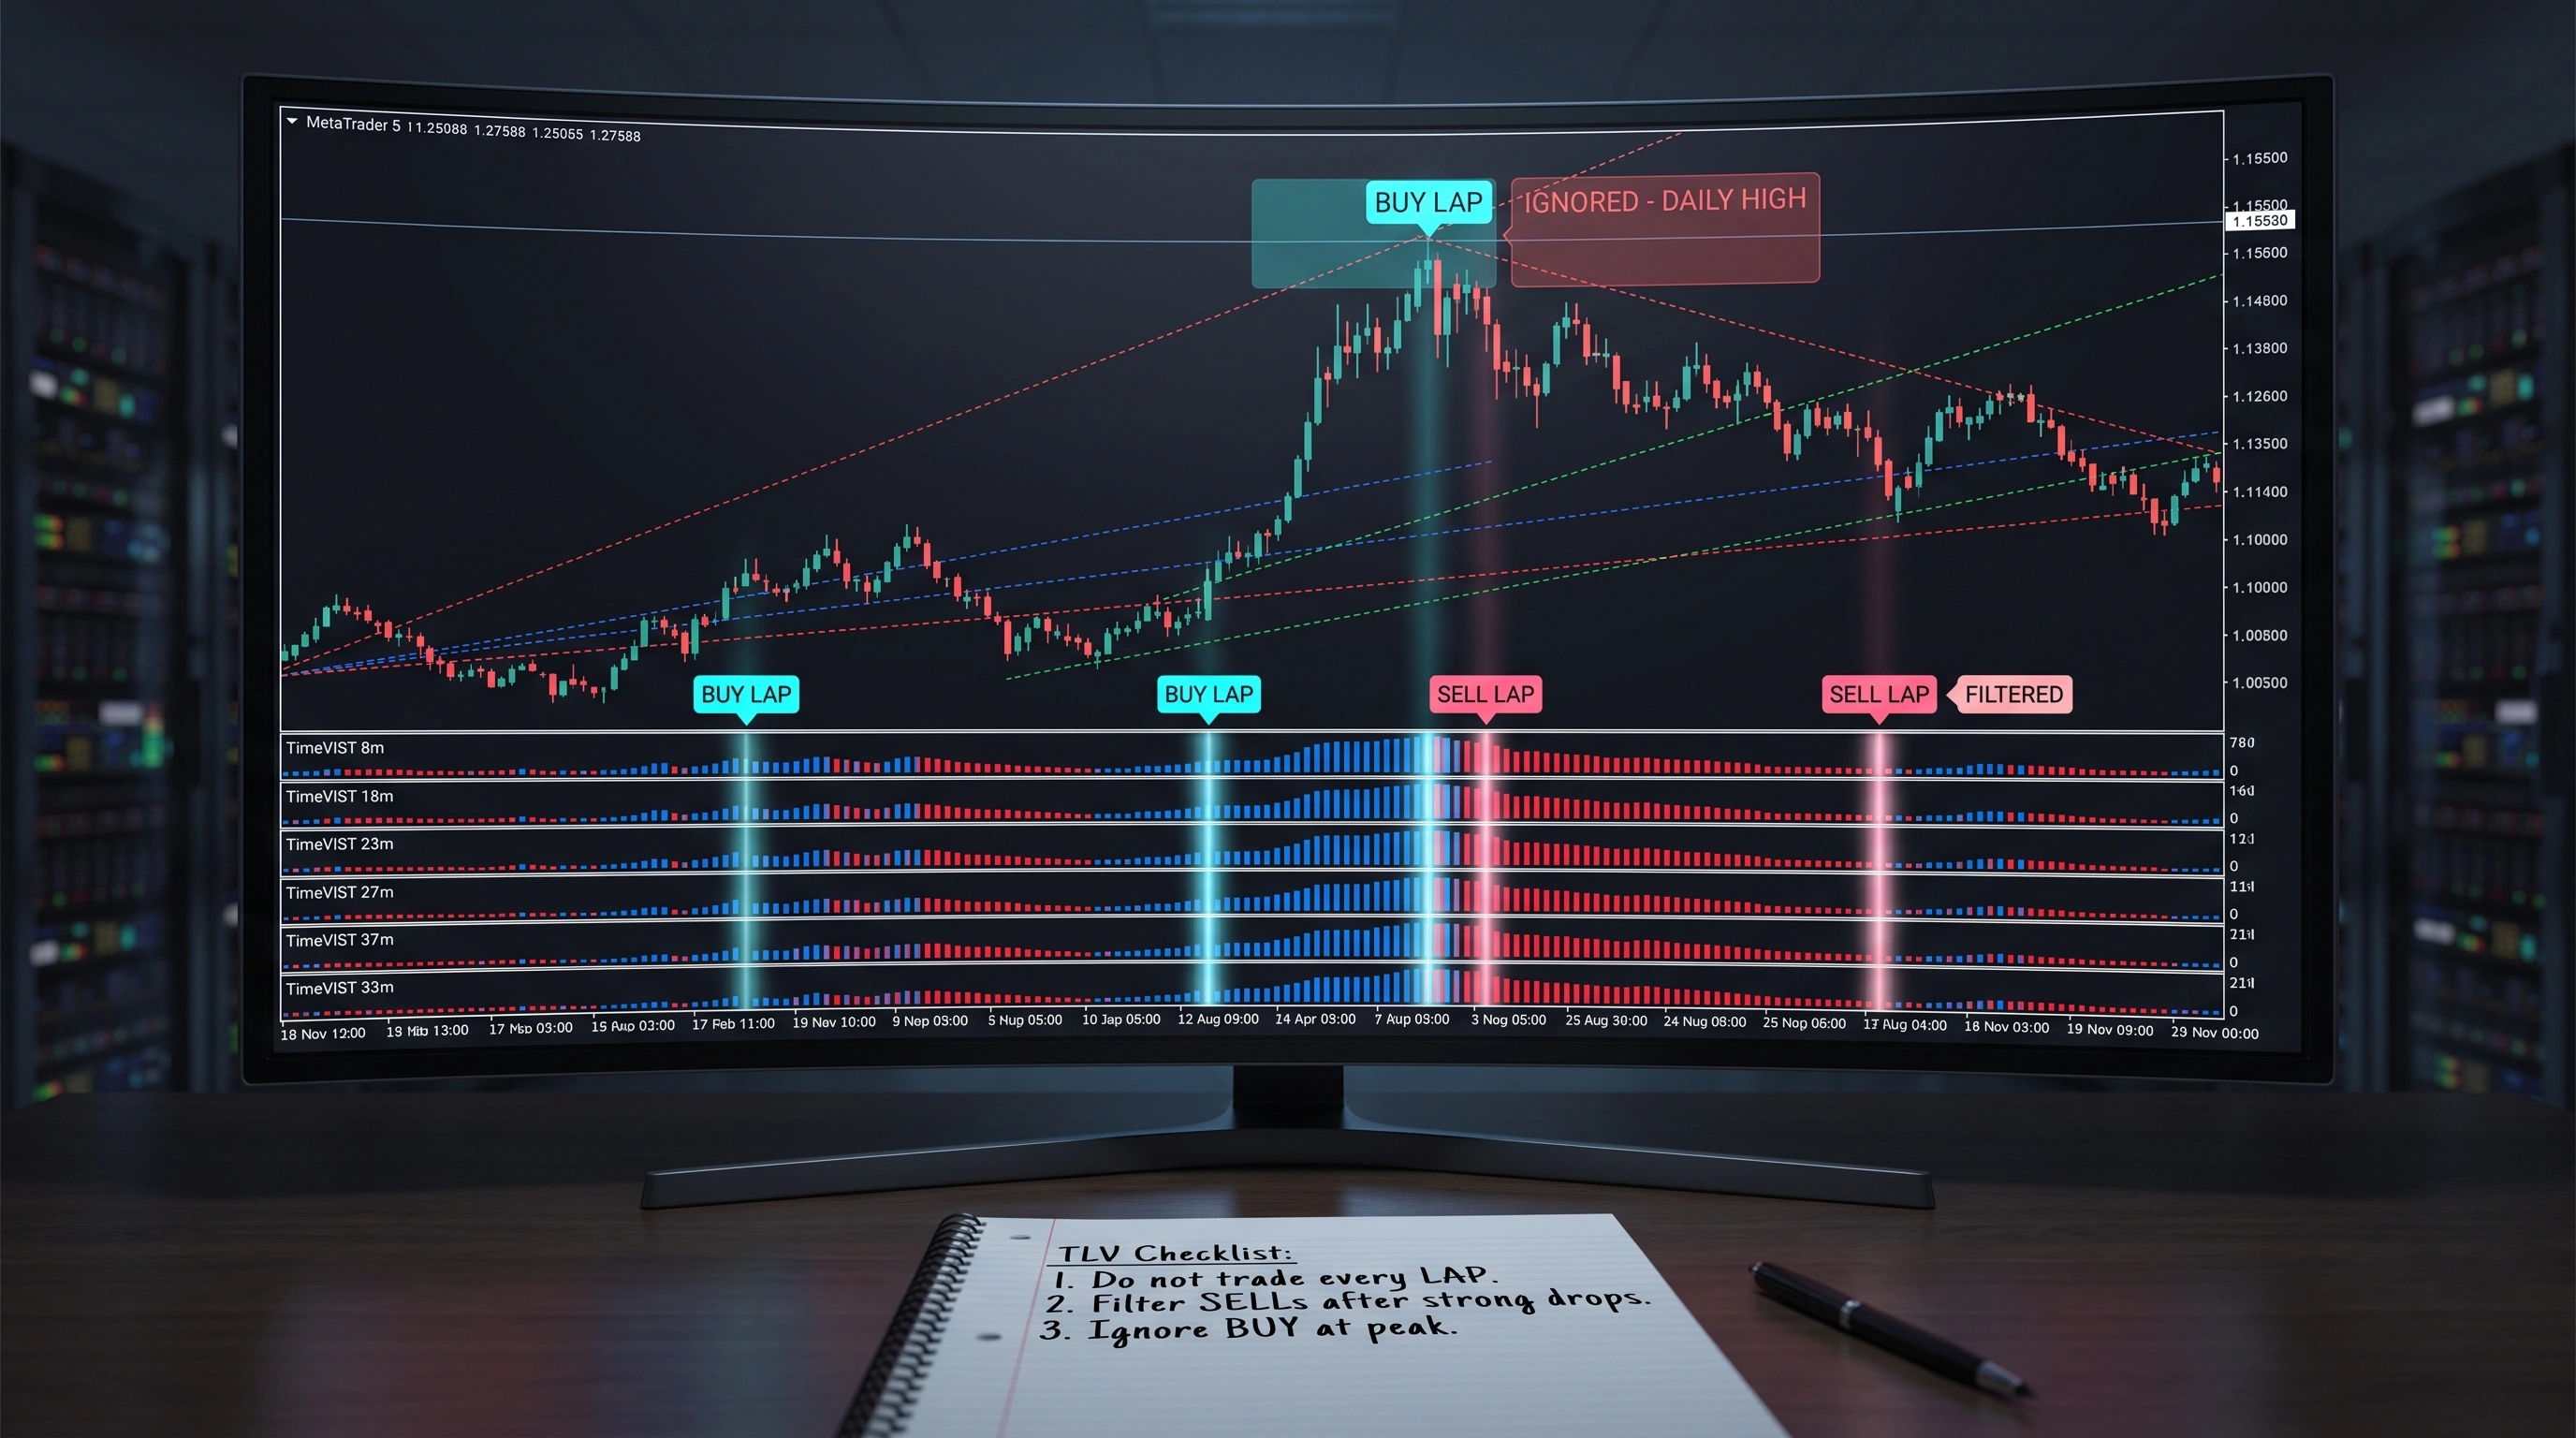
TimeVIST was created specifically for conducting our laboratory research on LAP spectra. With it, visual analysis becomes faster and more comfortable: in the lower section of the MT5 terminal, a vertical spectrum is displayed as a glowing pillar where the histograms of all lanes from 8m to 33m align into a single straight vertical line.
How to apply a Vertical Spectrum
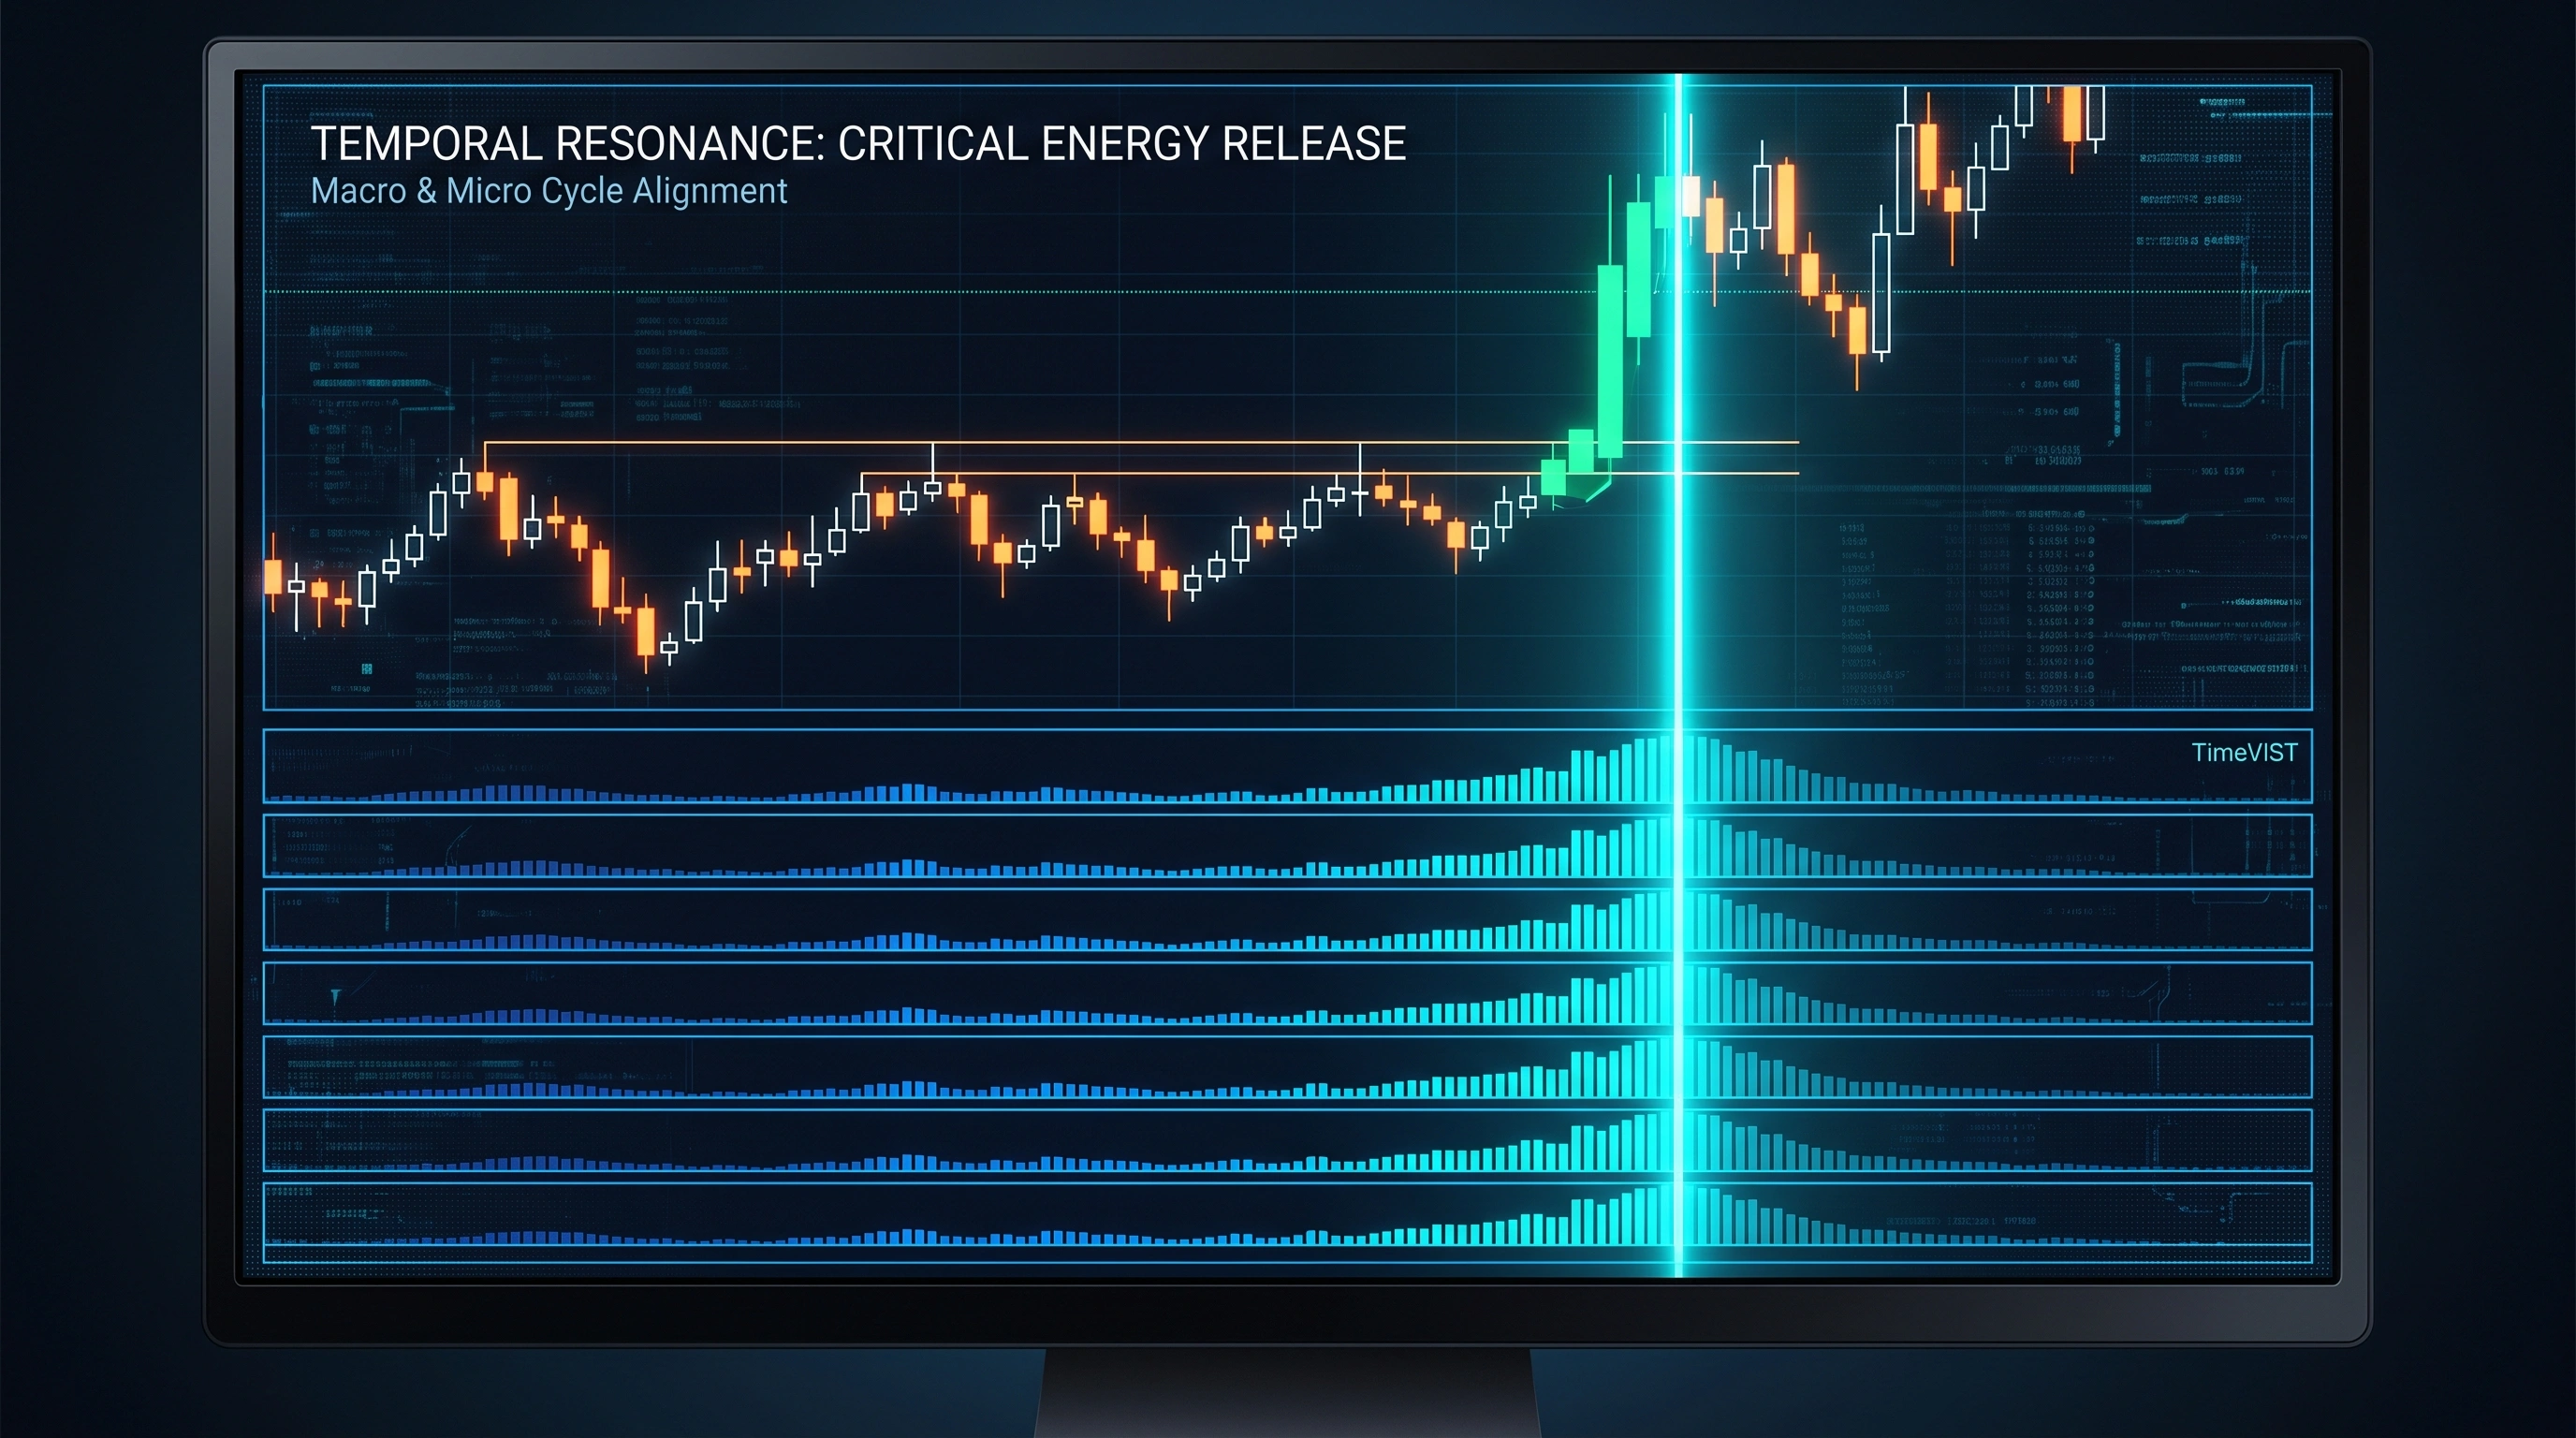
Critical Energy: Vertical synchronization is a catalyst for volatility. If horizontal accumulation culminates in a clear vertical alignment (for example, 9m, 15m, and 33m synchronously issue a BUY), this is a zone of maximum attention.
Your Action: It is precisely during these moments that the market structure is most predisposed to release its accumulated potential. Upon confirmation of the price reaction (Price Action) in the direction of the LAP vector, strong directional impulses are formed.
Temporal resonance: synchronized cycles mark a point for heightened analysis of price reaction.
Spectral Divergence: The Zone of Uncertainty
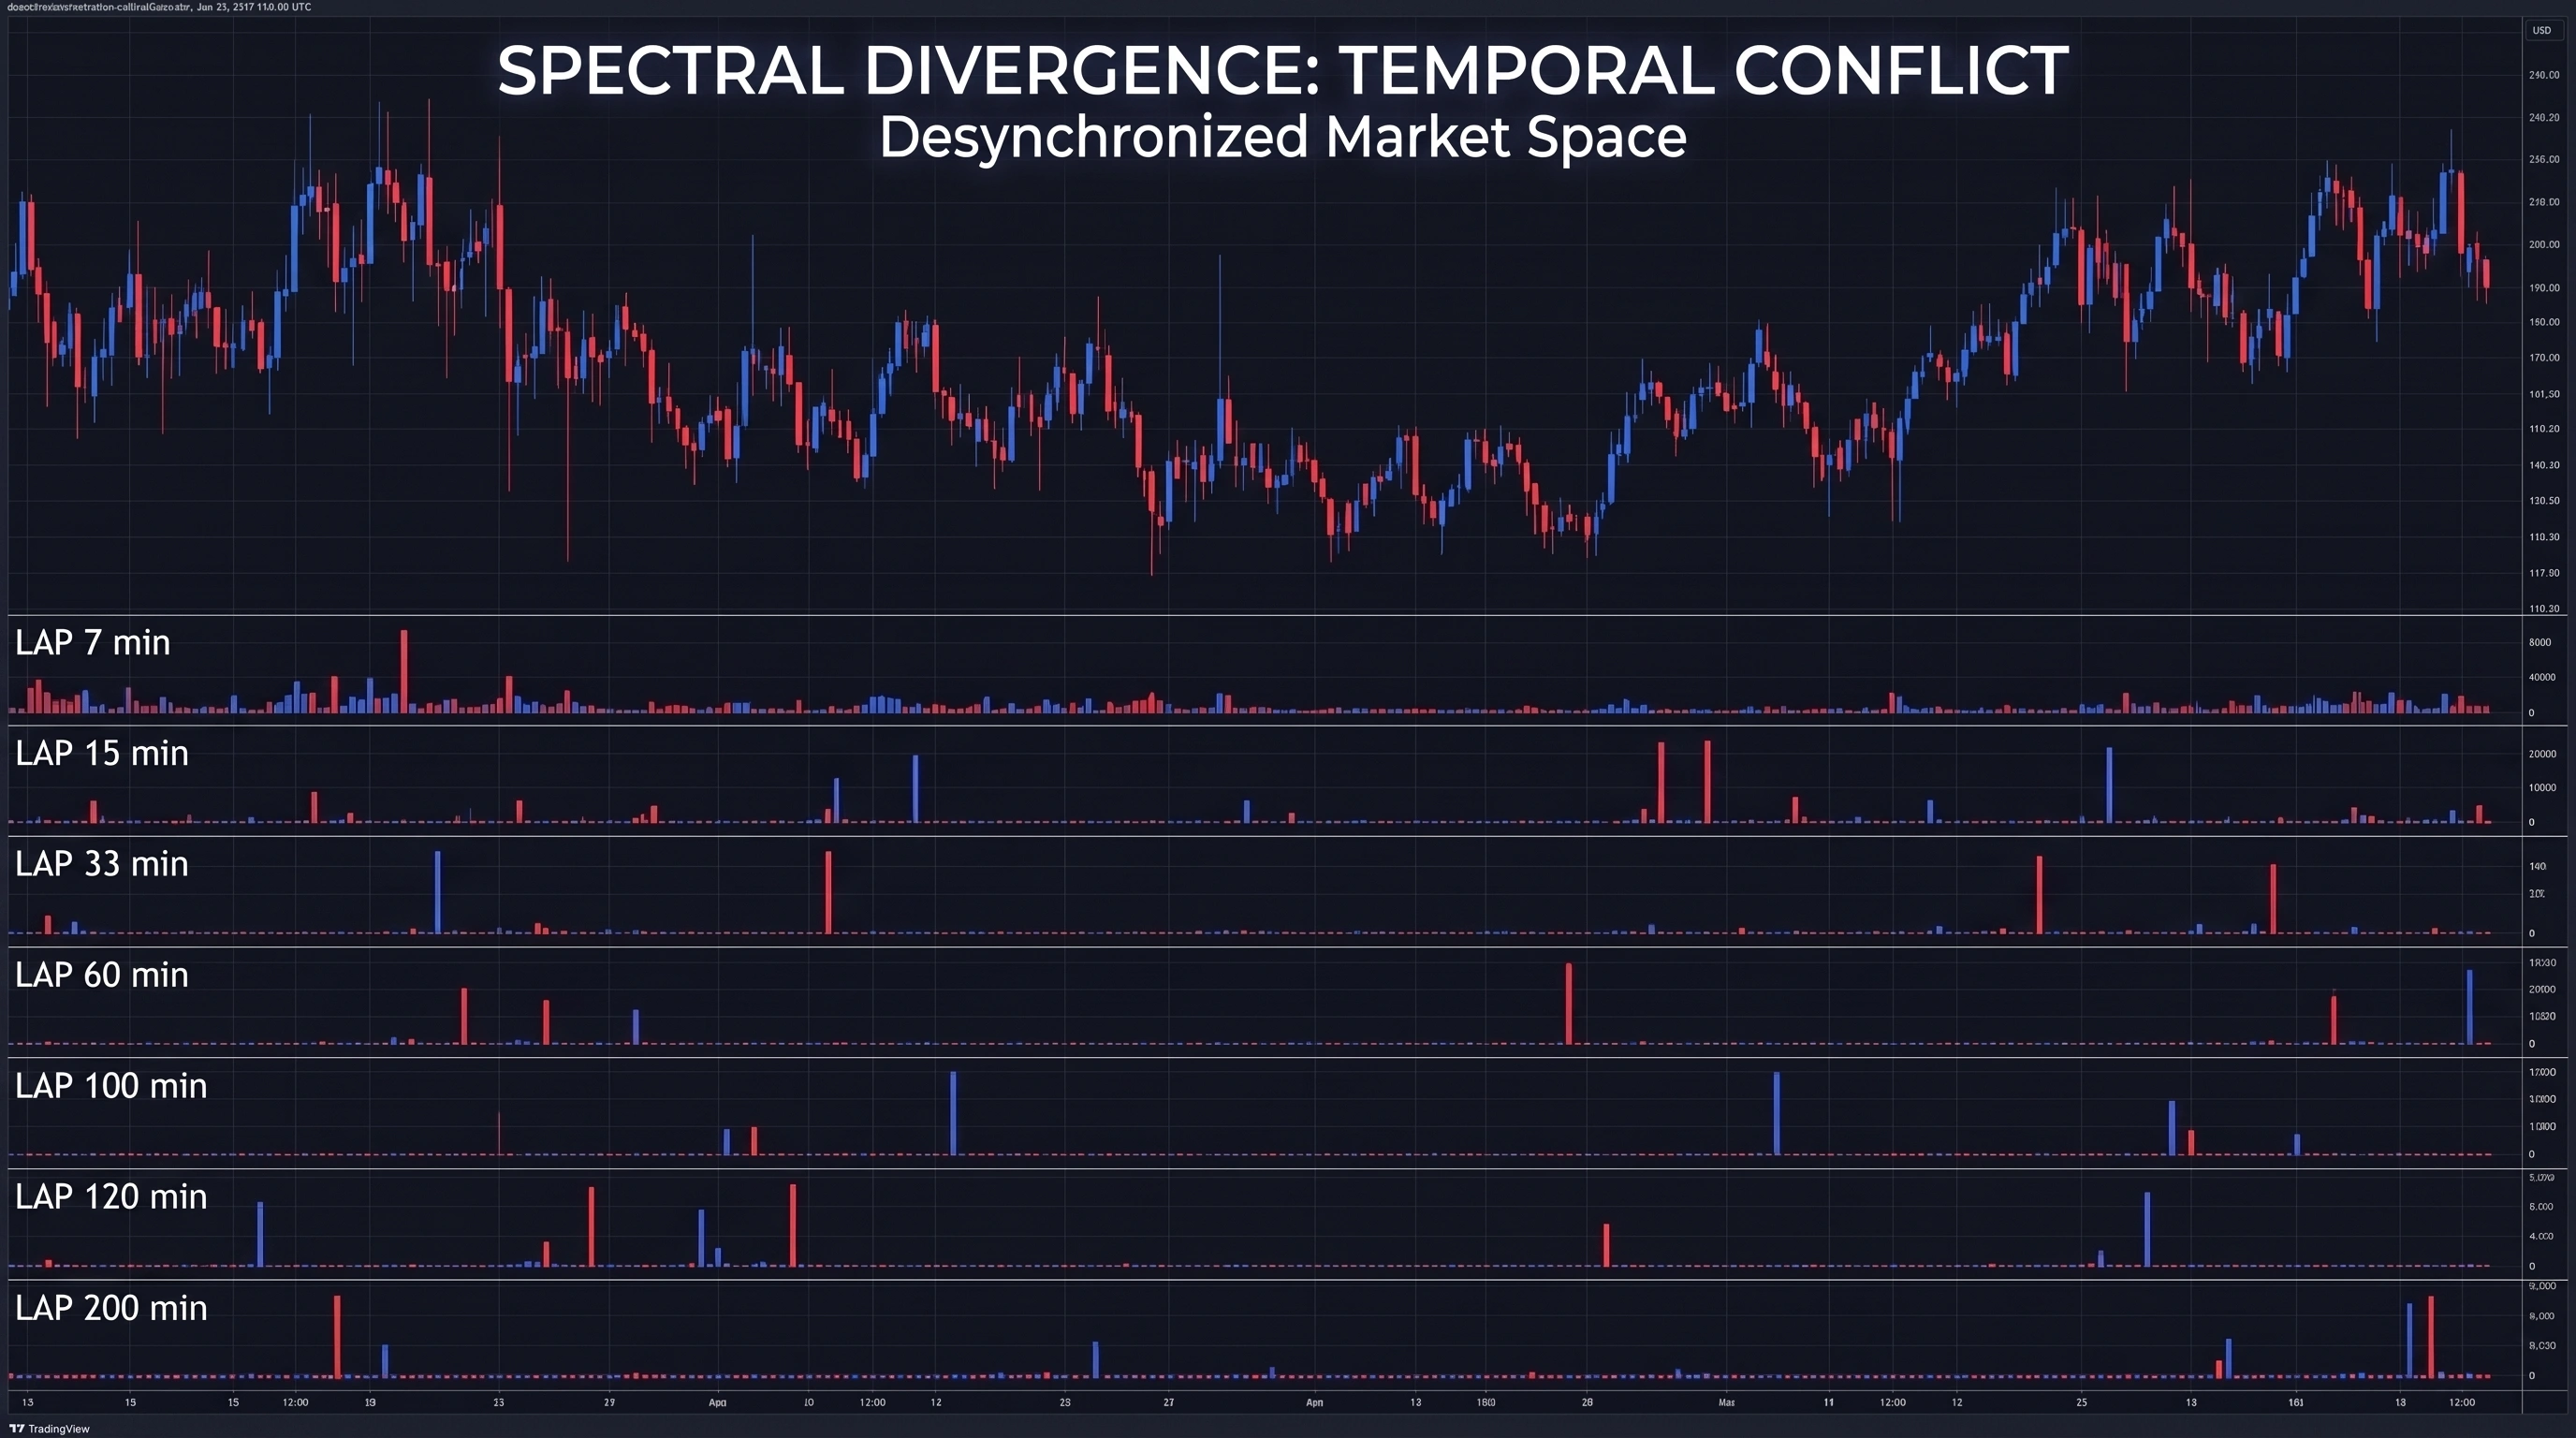
What should you do if there is no vertical resonance? Furthermore, what if the lower cycles indicate a BUY vector while the higher cycles show a SELL vector?
This phenomenon is known as Spectral Divergence.
In such a situation, a temporal conflict arises. Market time is desynchronized. During these periods, the price tends to behave chaotically, forming complex, unpredictable trajectories and deep wicks in both directions.
The TLV Rule: If a micro-vector contradicts a macro-vector, we treat this period as a high-risk zone. The optimal decision for a trader is to stay aside and observe, awaiting the moment when the cycles synchronize once again.
Spectral divergence: conflicting cycles are a reason to observe carefully rather than assume alignment.
Mandatory Requirement: Testing and Practice
Theoretical knowledge will not work without practical reinforcement. Do not perceive timings as readymade financial solutions. An LAP is a tool for developing a deep understanding of market mechanics.
You must test the indicator. Use the Strategy Tester in MetaTrader 5 on historical quotes. Scroll the chart backward and observe:
How the price behaves within long horizontal spectra (accumulation).
How energy is released at the moment of vertical synchronization.
How the market breaks its structure during spectral divergence.
Only through independent testing will you learn to “read” time and understand the true market structure using LAPs.
Summary: How to Read Time
An Isolated LAP is a reason to pay heightened attention to the chart, not a manual for immediate action.
A Horizontal Spectrum is the process of compressing a spring. The market is accumulating liquidity. The density of signals indicates the importance of the zone.
A Vertical Spectrum (Synchronization) is the moment of energy release (Temporal Resonance). The perfect coordinate where micro- and macro-targets converge for a strong directional impulse.
Spectral Divergence is a zone of cyclical conflict and chaotic price action. The best decision is observation.
The scientific approach of VISTmany proves: we do not guess the price direction; we mathematically calculate the time intervals during which the market is most predisposed to exit chaos and initiate a directional movement. Your task is to learn to see these moments and utilize them intelligently.
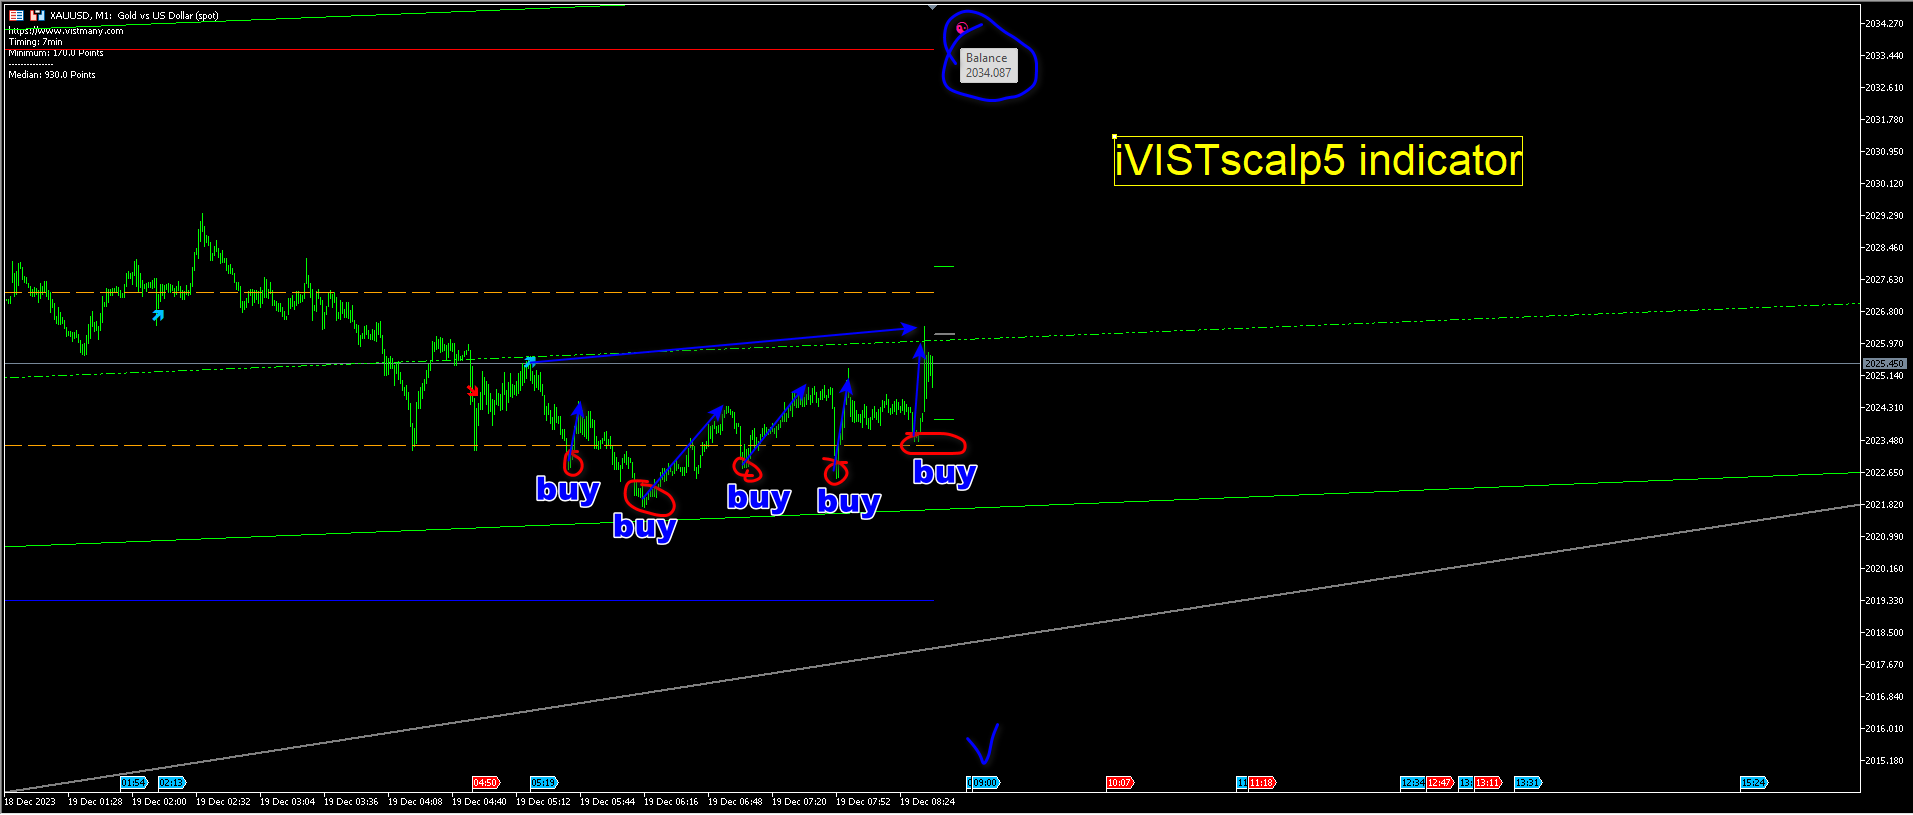
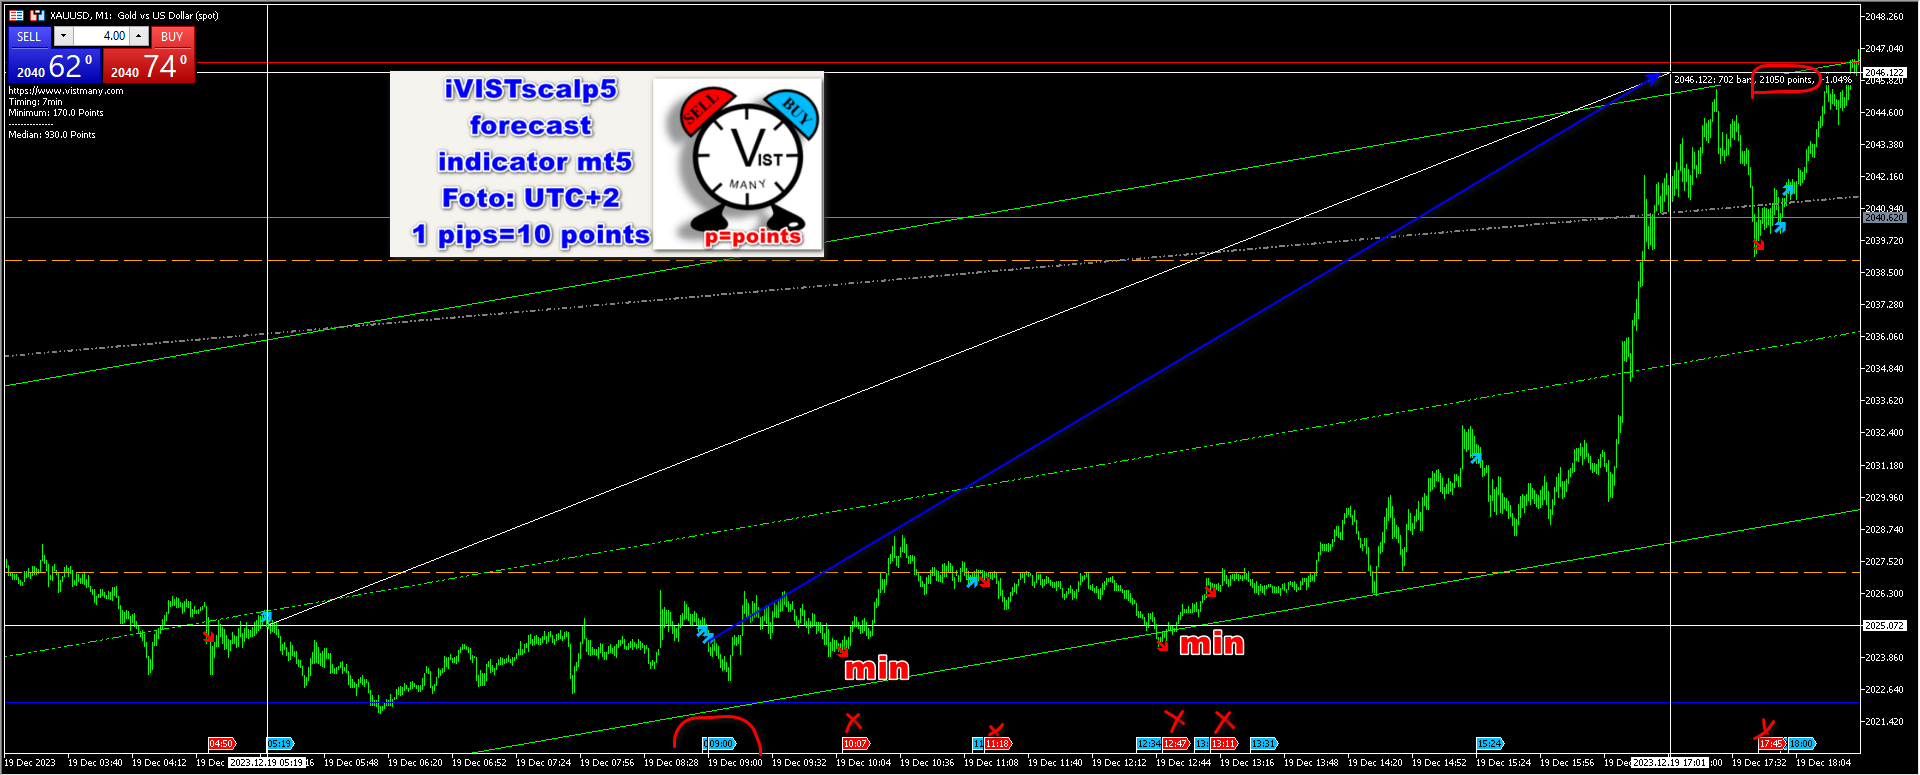
Example 1. Analysis and description of the trading situation on 12/19/2023. Buy timing 05:19 XAUUSD
Let's look at an example where we analyze the situation on XAUUSD on 12/19/2023. We use the iVISTscalp5 indicator for trading. In order to learn how to work with our VISTmany Time-Based Market Analysis, learn the rules of our scalping system. There is a decision-making procedure for opening an order by timing - it is +3 minutes. The VISTmany Time-Based Market Analysis is the key time levels where the moods of the big players in the financial market are clearly expressed.
Let's consider one of the basic rules:
1) If the price increased before the buy timing, we ignore the buy timing.
2) If the price decreases before the sell timing, we ignore the sell timing.
This is a simple rule of the scalping system by time levels. Many traders do not take into account the rules. This is a big mistake. Our Time-Based Market Analysis is scalping. That is, we take profit on a small price movement. If there was an increase of, for example, 2500 points/250 pips before the buy timing, and our forecast for the buy timing is 900 points/90 pips, it makes no sense to open a buy order at the time indicated in the forecast. Why? Because there is a high probability that the price will decrease to the nearest level. It is from this level that you can open the buy timing, if there is analytical confirmation for this. But the best option for novice traders is to ignore the buy timing if there was growth before it. Similarly, if there was a price drop before the sell timing.
General analysis of the XAUUSD pair. Why is buy timing relevant in this situation?
1. The price at the time of the buy 05:19 timing is close to the minimum of the daily channel. In such cases, the price is likely to test the minimum or break through it. Therefore, the input for this timing must be carried out from the channel boundary. If the price is flat, then you can open a buy order several times in the vicinity of the timing. We just need to remember that we are scalping. You should have quick deals. You do not need to hold orders for a long time, especially if you still have the experience of a novice trader.
2. Ahead we see a sequence of buy timings (08:57-09:00). This provides additional context for the potential direction of XAUUSD price movement.
3. In the iVISTscalp5 indicator, we calculated the price balance. There is a pink circle on the chart. Balance is a magnet where the price tends to return. In our situation, the balance is far at the top. This is another confirmation for gold purchases at the moment.
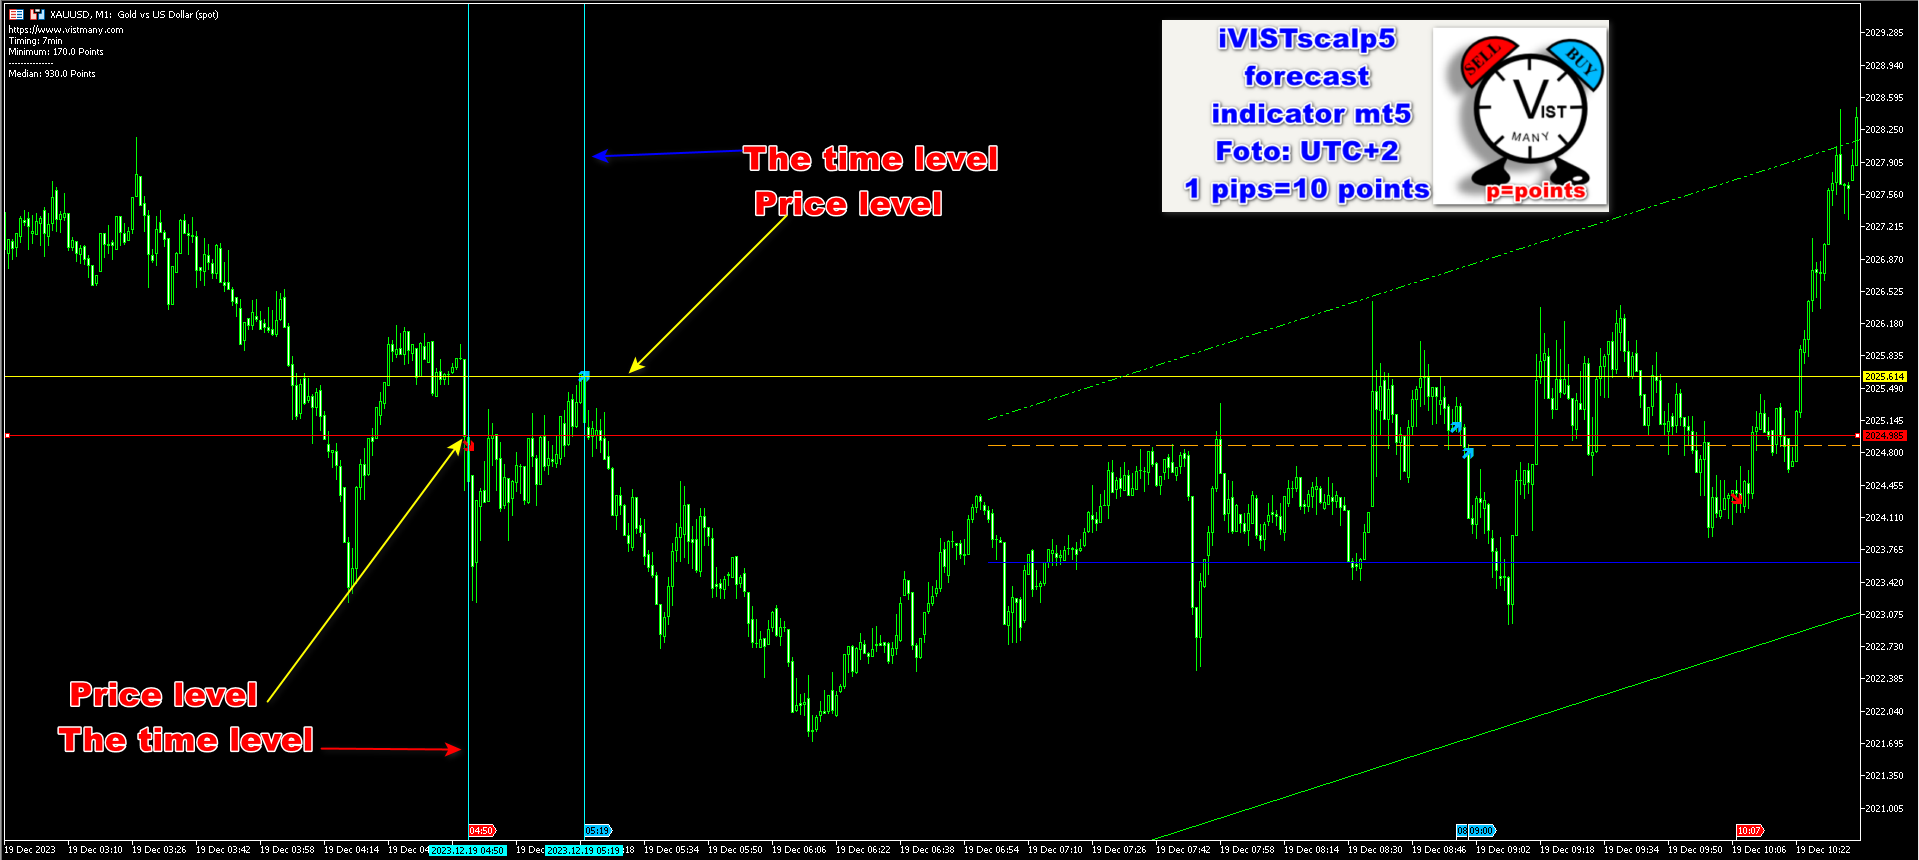
4. The price in our forecasting paradigm moves from timing to timing, that is, from one time/price level to the second time/price level. Two timings are highlighted in the photo (shown by arrows) – sell 04:50 and buy 05:19. The price level at the onset of the sell timing 04:50 -2024.905 , the price level at the onset of the buy timing 05:19 – 2025.600. ↑
Broker Registration
Opening a broker account is not required to study the VISTmany materials. If you decide to open one, first check the broker's terms, local availability, and the risks of trading financial instruments.