
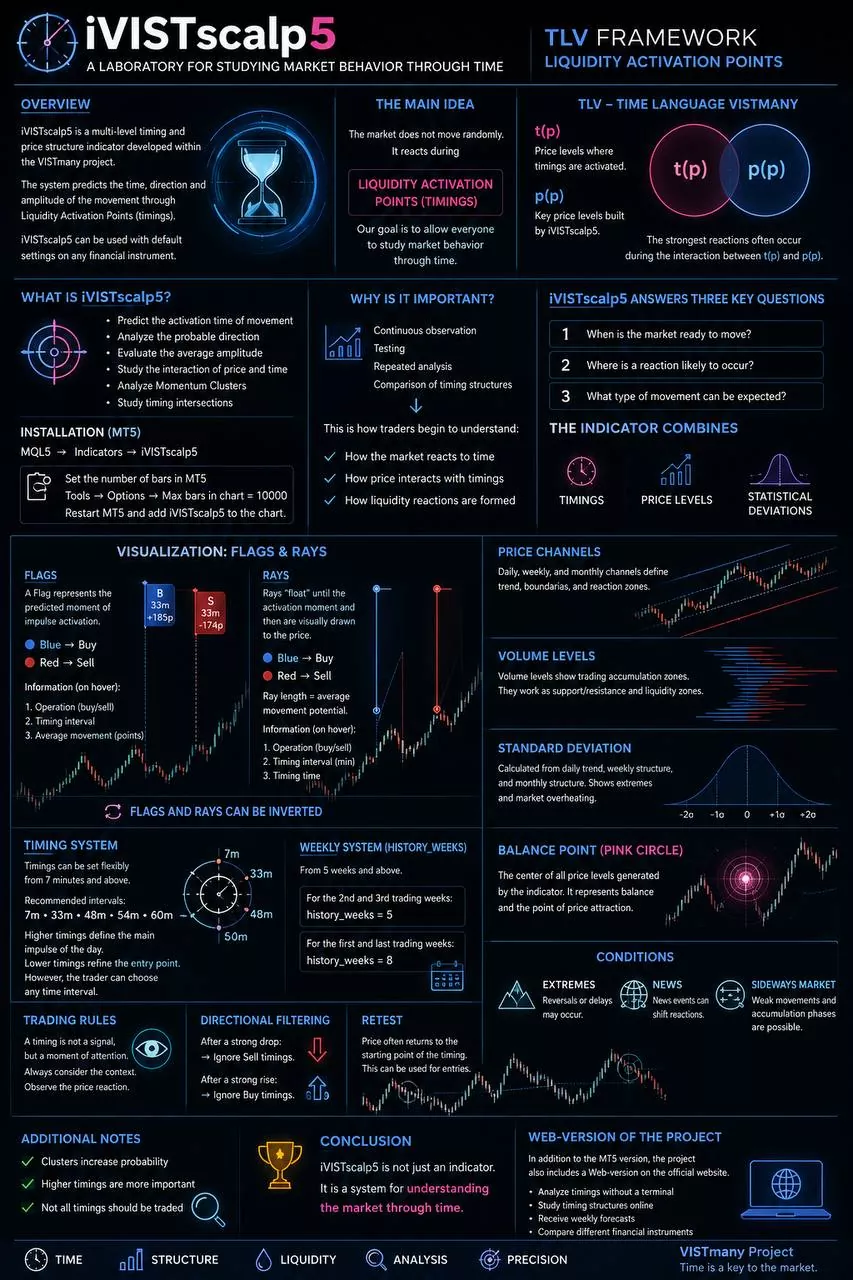
iVISTscalp5 — Timing-Based Market Time-Based Market Analysis iVISTscalp5 is not a typical trading indicator. It is a timing-based Time-Based Market Analysis designed for MetaTrader 5 that focuses on when the market is most likely to move, not just where the price may go. Unlike traditional indicators that analyze price, volume, or trend, iVISTscalp5 works with time cycles, market rhythms, and recurring timing patterns.
🔹 What makes iVISTscalp5 different?
• Provides exact timing (time windows) for potential market reversals
• Generates BUY / SELL forecasts based on time levels • Calculates average profit potential for each timing • Builds weekly forecasts in advance • Works with 120+ financial instruments (Forex, Gold, Indices, Crypto, Stocks, Oil, Gas)
🔹 Dual Forecast System iVISTscalp5 displays two types of forecasts simultaneously:
• Short-term (e.g. 7 minutes) — for fast scalping
• Mid-term (e.g. 60 minutes) — for trend direction
This allows traders to see both: 👉 precise entry timing 👉 overall market structure
🔹 Key Concept The core idea behind iVISTscalp5: The market is driven not only by price, but by time. Price can move unpredictably — but significant movements often occur at specific time intervals. iVISTscalp5 is designed to identify these moments.
🔹 Ease of Use • Works out of the box with optimized settings • No complex configuration required • Suitable for both beginners and experienced traders
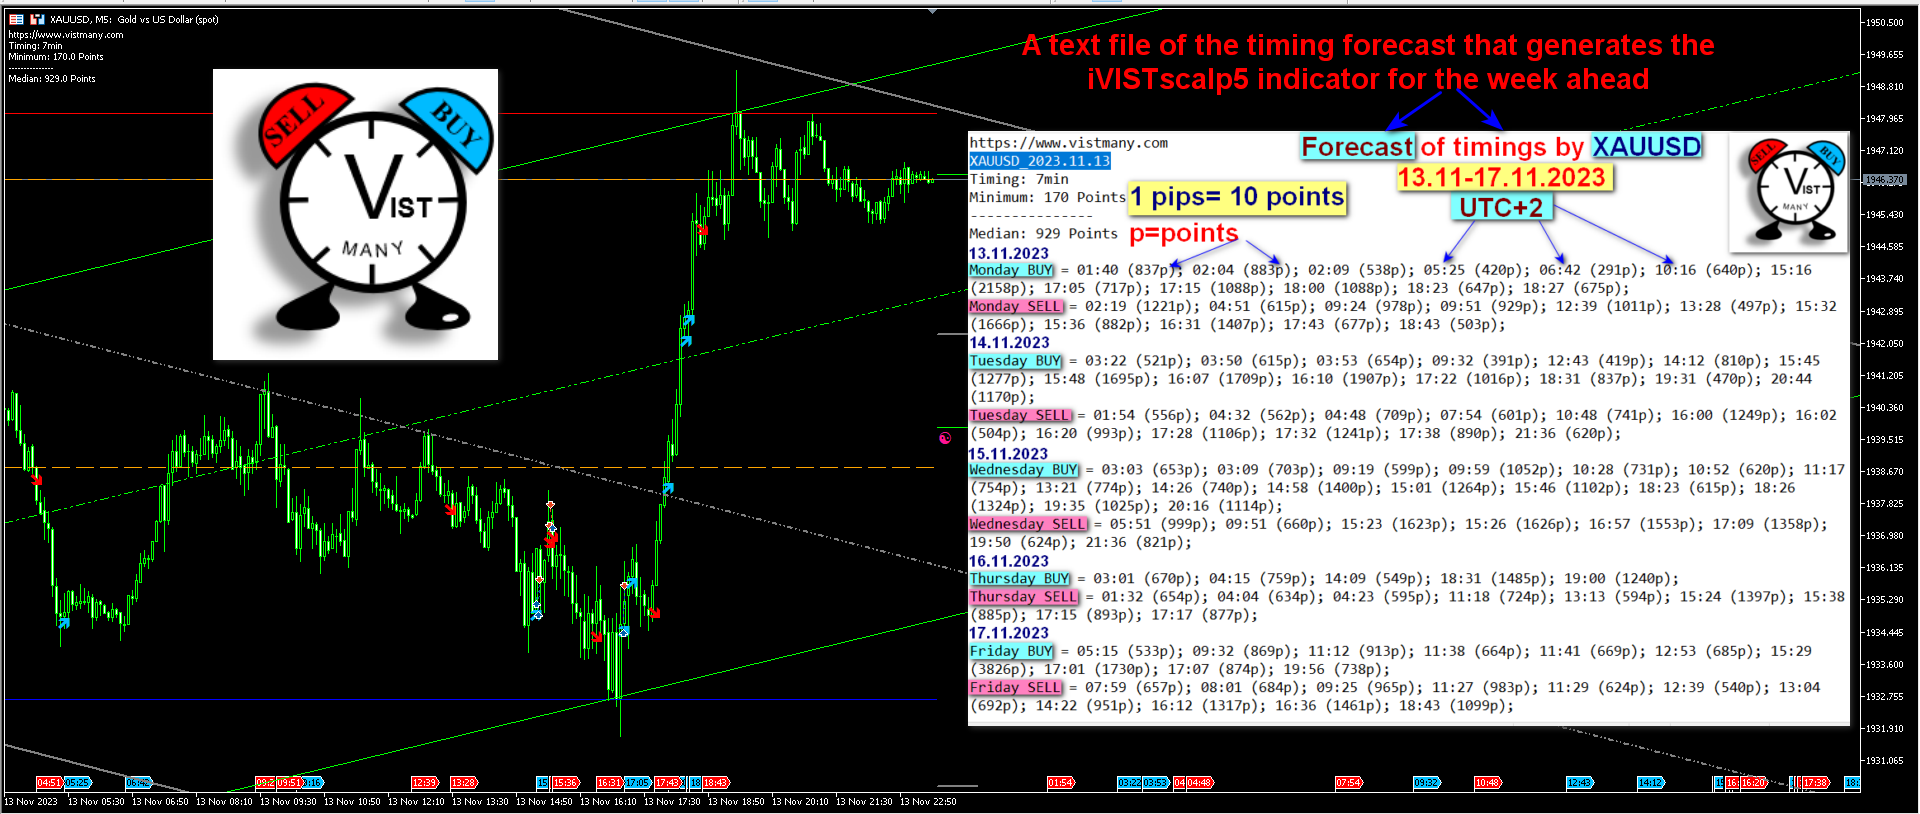
🔹 Weekly Forecast Planning The system allows exporting a full weekly forecast in text format, including:
• exact timing • direction • potential profit
This enables traders to plan their trading week in advance.
⚠️ Important Note iVISTscalp5 is not a “holy grail”. It is a professional tool for working with market timing, and its effectiveness depends on discipline and risk management.
🔑 Summary iVISTscalp5 shifts the focus from: ❌ “Where will price go?” to ✅ “When will the market move?”
⏰
iVISTscalp5 — Your Timing Edge in the Market
Stock trading or trading with forex brokers presents a high risk of losing funds. Every profession requires learning, but many people enter trading with the ease of just two buttons in the terminal - buy and sell. Of course, simplicity is brilliant, but for some reason, people are led to believe that trading is an easy craft. This is a huge mistake to succumb to such an opinion. This path leads to the loss of your funds.
Time to make money. With the rapid development of modern technologies, trading principles are changing very quickly. It is very difficult to enter the financial trading profession without preparation. Before starting such a craft, find a teacher. It's difficult, but possible. Otherwise, your work will turn into a pure lottery, and ultimately, you will lose your capital.
Today, I will continue describing our proprietary scalping system. For a long time, we have been providing free signals for financial instruments. However, any system needs to be carefully studied before applying it to real trading. But people don't like to strain their brains and want to get everything at once. If they fail, they look for someone to blame. But that's not the case. We have left a few tools that can be used to get free signals. Everything else is paid for. I think that when a person buys something, invests their money, they will be more motivated to study the topic and engage their brain. Trading on the stock exchange is always risky. We also have failures if we violate the rules of our system. Today, let's talk a little about the rules of the proprietary VIST system.
I think there is no one who would refuse to have a forecast for entering a trade for financial instruments for the upcoming week. The entire VIST project system is based on time levels and is designed for intraday trading. The system's indicators and scripts perform an important and unusual task - they calculate timing (time levels) and display them in the terminal as flags (trading signals) for any financial instrument (currency, metals, oil, cryptocurrency, stocks, indices) for the upcoming week. A blue flag means buy, a red flag means sell. Every Monday, the trader receives timing (time levels) for the entire week for any instrument. All that remains is to apply their risk management system, assess the situation on the trading instrument, and off they go!
The timing system is a creative approach. We strongly recommend observing the system's signals for at least a week (consider it as working in a laboratory), examining different instruments, and setting different parameters for the system, analyzing the timing's performance history. It is worth remembering that this approach is more suitable for scalping style trading. You need to take the profit recommended by the script or indicator. The rest, such as waiting, managing the trade, and maintaining risk, is all up to your trading experience.
There are several tools available in our proprietary VIST timing system:
1. The free VistScalp5 script for MT5. Each week, we provide two instruments (sometimes more) for these scripts that you can observe, analyze, and study. After a week of studying, you can start using the trading signals (timings). Don't rush, take the time to thoroughly understand everything. If you're a beginner, you'll need at least a month to learn how to work with timings. The iVISTscalp5 indicator for MT5 can be rented on a monthly basis, in addition to being available for purchase. This provides access to all the instruments available on MT5. We refer to these products as trading laboratories. You can choose any trading parameters and any instrument you want. The iVISTscalp5 indicator provides you with trading signals (timings) that you can choose from. There is an automatic mode where the indicator provides optimal values. Working with the indicator opens up great opportunities for market research.
2. Day trading, scalping (working within 7-60 minutes). Sometimes it takes more time. News, expiration, geopolitics can all play a role.
3. The VIST system is designed for traders of any level.
4. Whether you use the free script VistScalp4/5 or the iVISTscalp5 indicator, they are both based on the same proprietary method. The free script has limited capabilities in terms of using financial instruments (there are only a few available). The iVISTscalp5 indicator can be used on all financial instruments available in your terminal. The indicator automatically adjusts to the time of your terminal.
5. In the indicator, for the instruments you specify, there is a text file with a forecast for the next week. Path: MQL--File--Text file. It may be useful for someone to print out all the signals.
6. It can be applied to binary options.
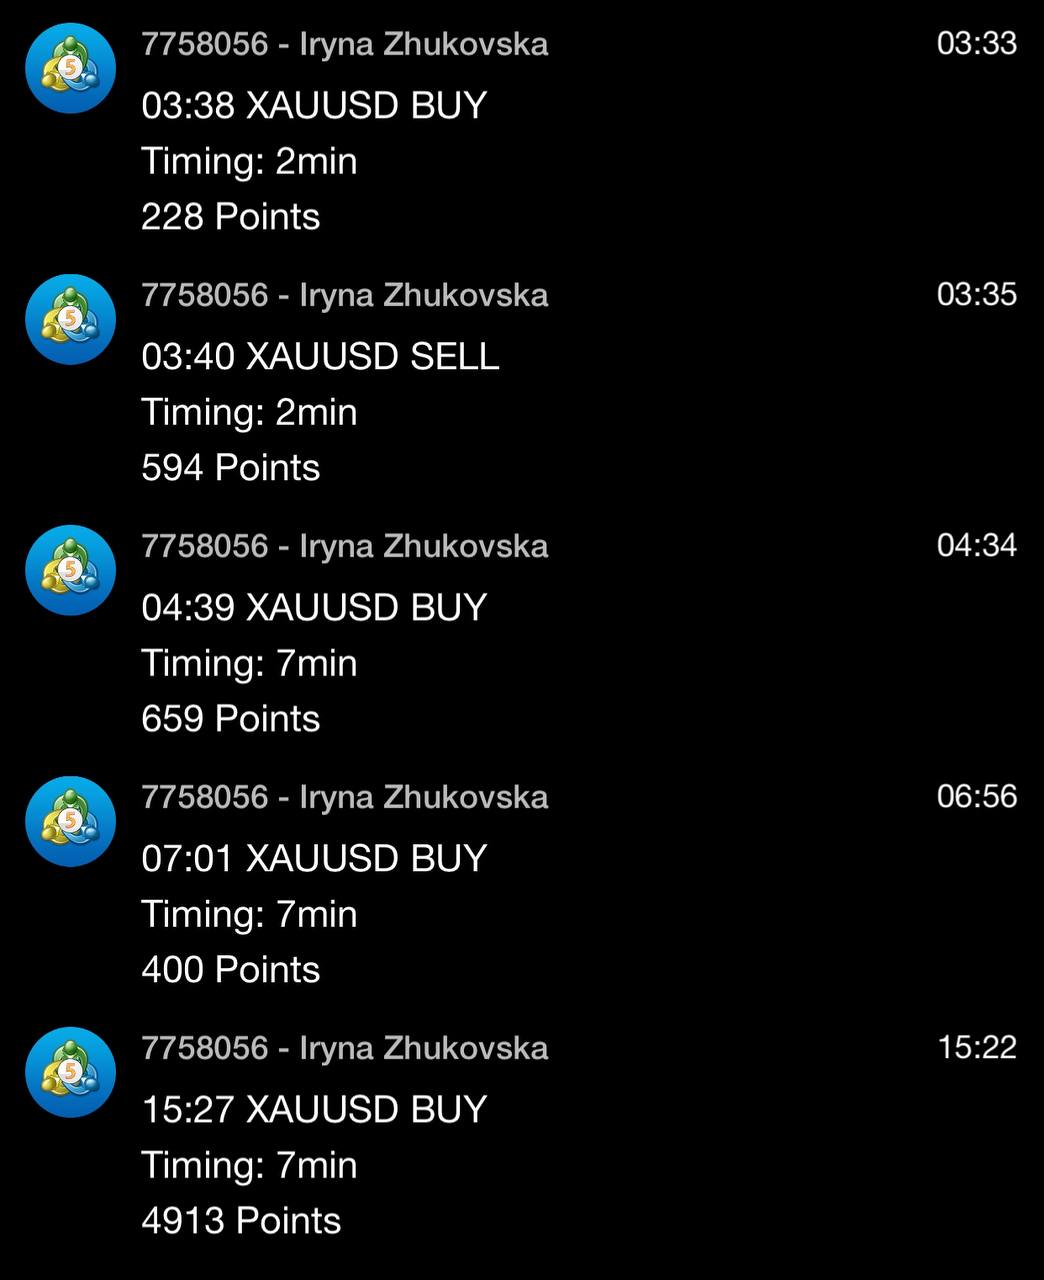
7. The blue flag indicates a BUY signal, while the red flag indicates a SELL signal. The entry time is indicated on each flag.
8. In the iVISTscalp5 indicator, you can see on the flag how many pips of profit can be obtained from the timing signal.
9. The iVISTscalp5 indicator has a pre-set trader alarm clock.
10. The timing entry error is approximately plus or minus three minutes. It is necessary to look for the best entry point in the vicinity.
11. If the price has made a significant movement in one direction, do not enter the timing in that direction, if there is one.
12. Watch for support levels (do not enter sell timing) and resistance levels (do not enter buy timing).
Manipulations in the trading system are still a possibility. Our trading hours are from 3:00 to 19:00 (GMT/UTC+2). We do not trade on Fridays and during quarterly expirations. It is better to skip Thursdays and Fridays in the first and last week of the month. It is also recommended to avoid trading during important news releases until you have thoroughly studied the system and gained experience in trading.
The iVISTscalp5 indicator is a time machine for trading
11. If there is a need to update the iVISTscalp5 indicator, then switch the timeframe button in the mt5 terminal from 1 MINUTE to 5 MINUTES. After that, return the indicator to the working mode - the timeframe is 1 MINUTE. When do I need to update the indicator? If the timings or the main levels and channels of the iVISTscalp5 indicator are not displayed on the chart. Such situations occur when your mt5 terminal has been disconnected for some time.
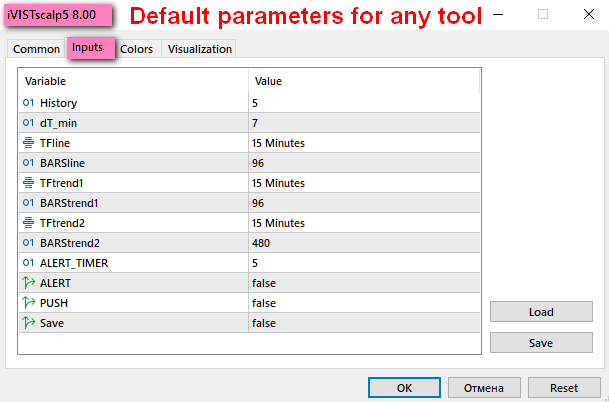
12. By default, the parameters of the iVISTscalp5 indicator are configured so that, ideally, you should get a profit within 7 minutes. According to statistics, these are the best parameters for scalping. But a trader can optimize the iVISTscalp5 indicator to suit his trading style.
13. In the mt5 trading terminal, you can open several windows of the same financial instrument and install the iVISTscalp5 indicator with different parameters in each window. Or open windows with different financial instruments and install the iVISTscalp5 indicator on each one.
14. In the iVISTscalp5 indicator, it is possible to configure push notifications, as well as notifications in the computer version of the mt5 trading terminal. Push notifications come to the phone and warn in advance about upcoming forecasts. You can set the notification time yourself.
The procedure for installing the iVISTscalp5 indicator in the MT5 terminal:
1. Tools--Options--Charts--Max bars in chart: Unlimited
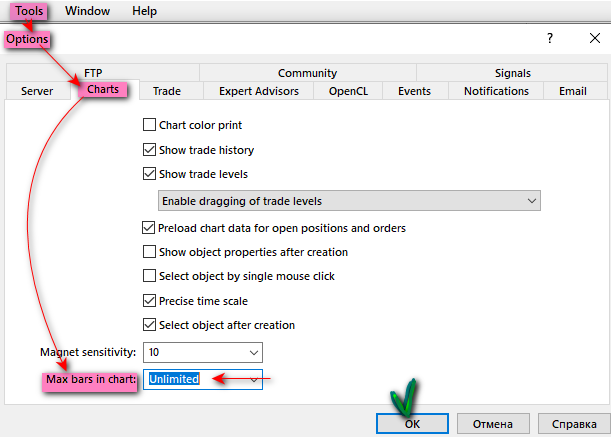
2. After that, close the mt5 terminal window. We do this to update the mt5 settings.
3. Start the mt5 terminal again.
4.View--Symbols--XAUUSD--Bars(M1)--
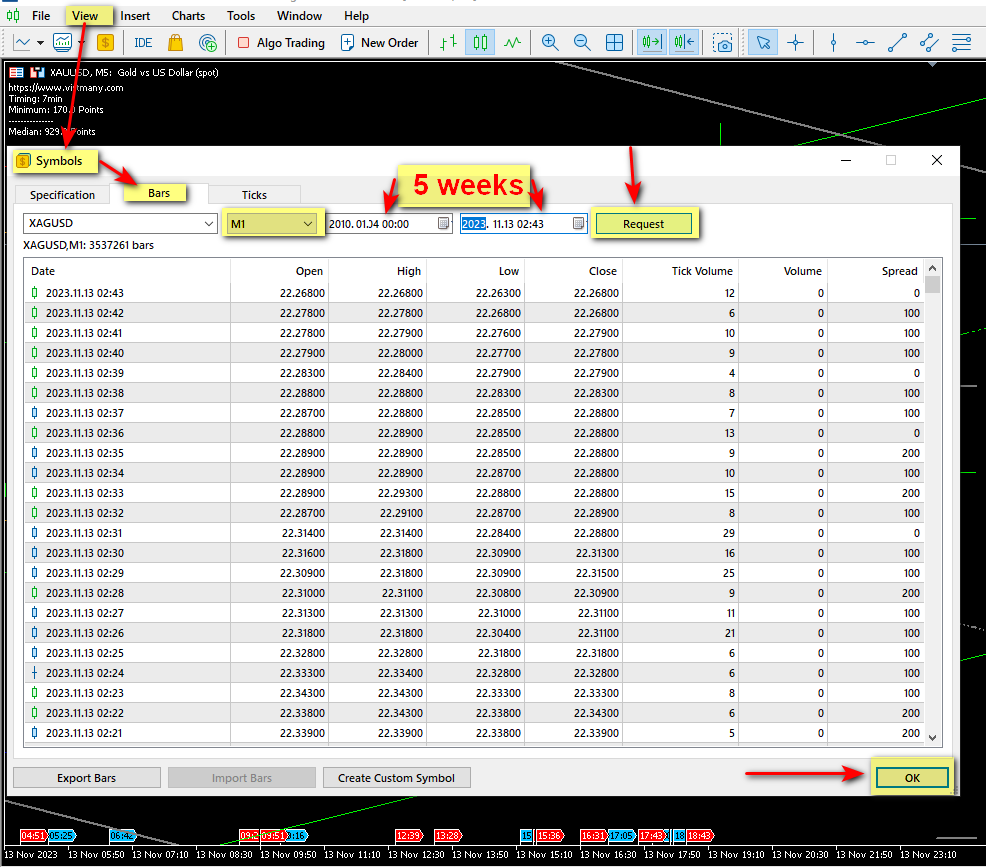
5.View--Symbols--XAUUSD--Ticks (All ticks)--
6. Put the iVISTscalp5 indicator in the MQL--Indicators folder
7. After that, close the mt5 terminal window. We do this to update the mt5 settings.
8. Start the mt5 terminal again.
9. Opening the XAUUSD graph on a 1 minute time frame. We remove everything superfluous from the chart: the grid, tick volumes. We leave a clean schedule.
10. Drag the indicator to the chart on the timeframe of 1 minute. Ready!
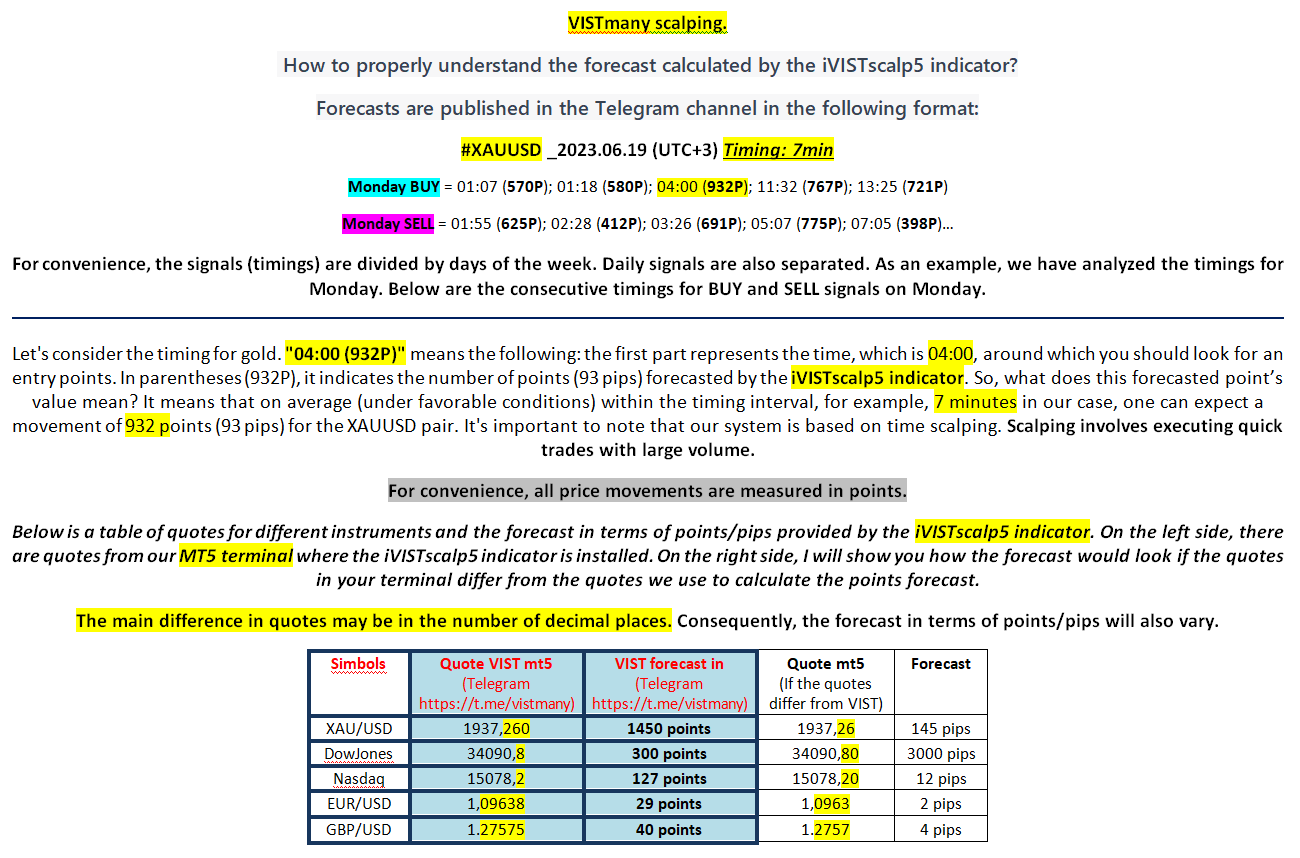
How to properly understand the forecast calculated by the iVISTscalp5 indicator?
Forecasts are published in the Telegram channel in the following format:
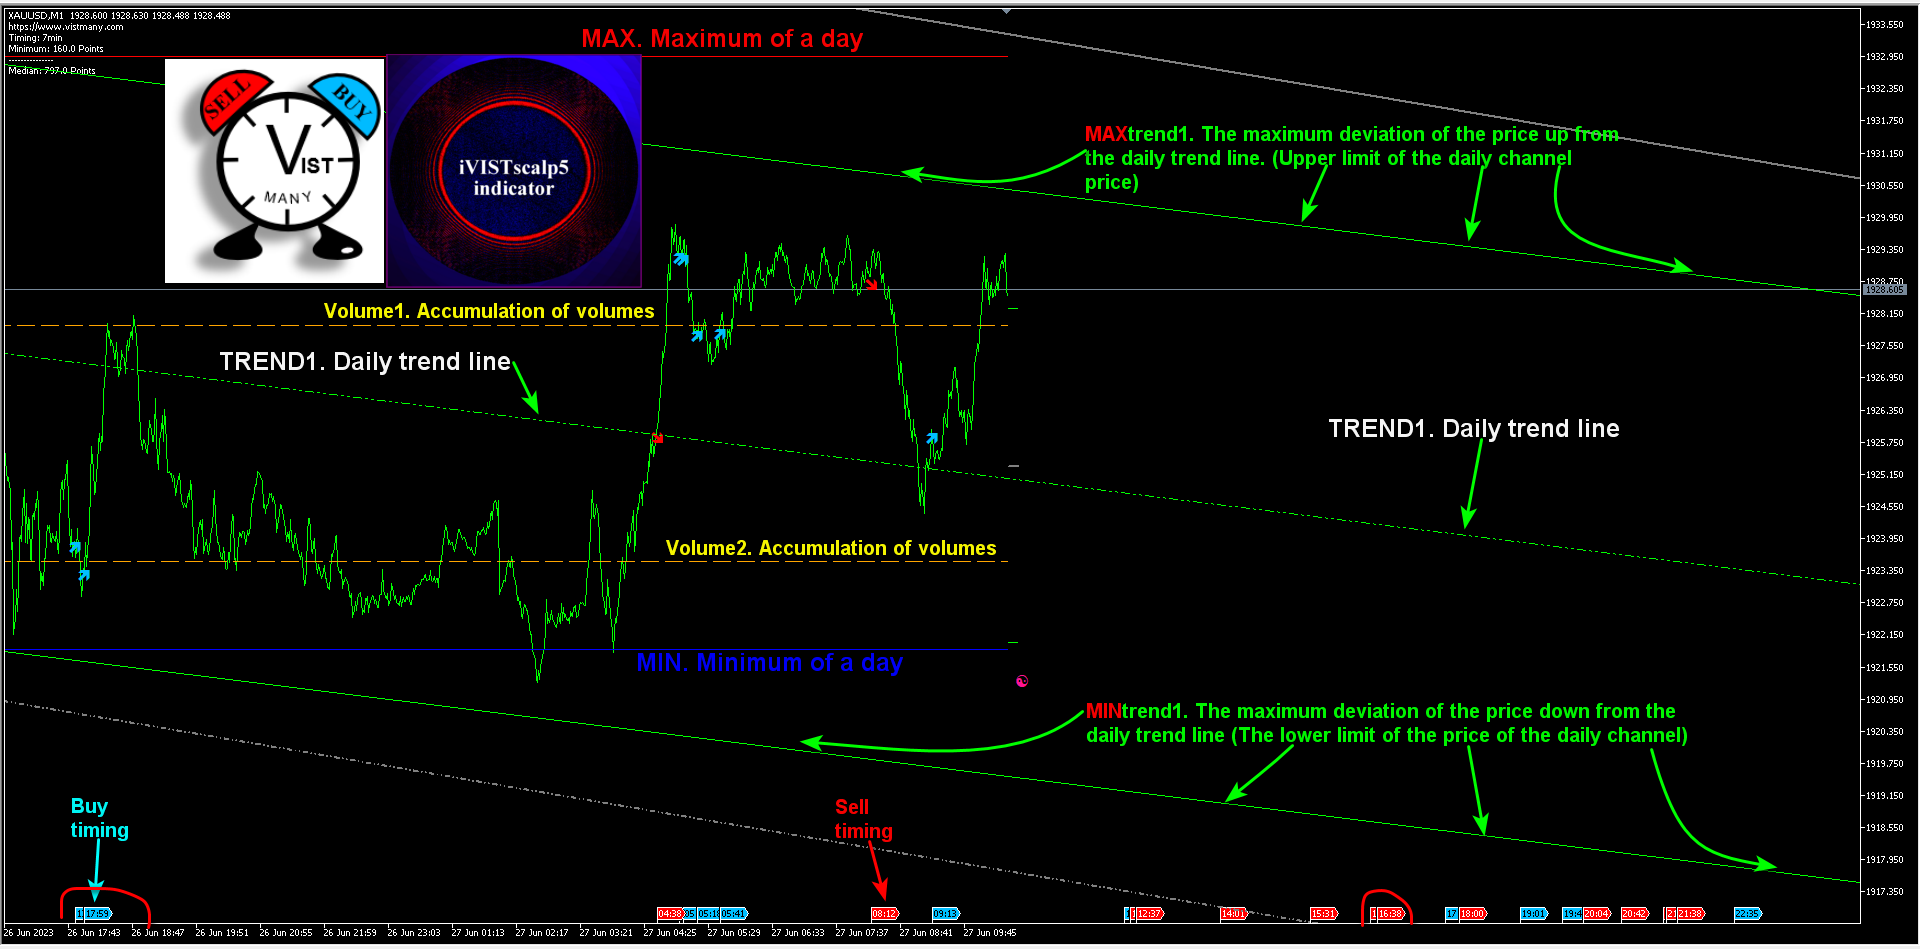
The iVISTscalp5 indicator. Description of visualization tools On the chart of any trading instrument, we know the timings (time levels) for the week ahead. Other levels on the chart are created so that the trader can easily determine where the price of any financial instrument is located in space. Price time levels (timings) + drop prices in space = profit.
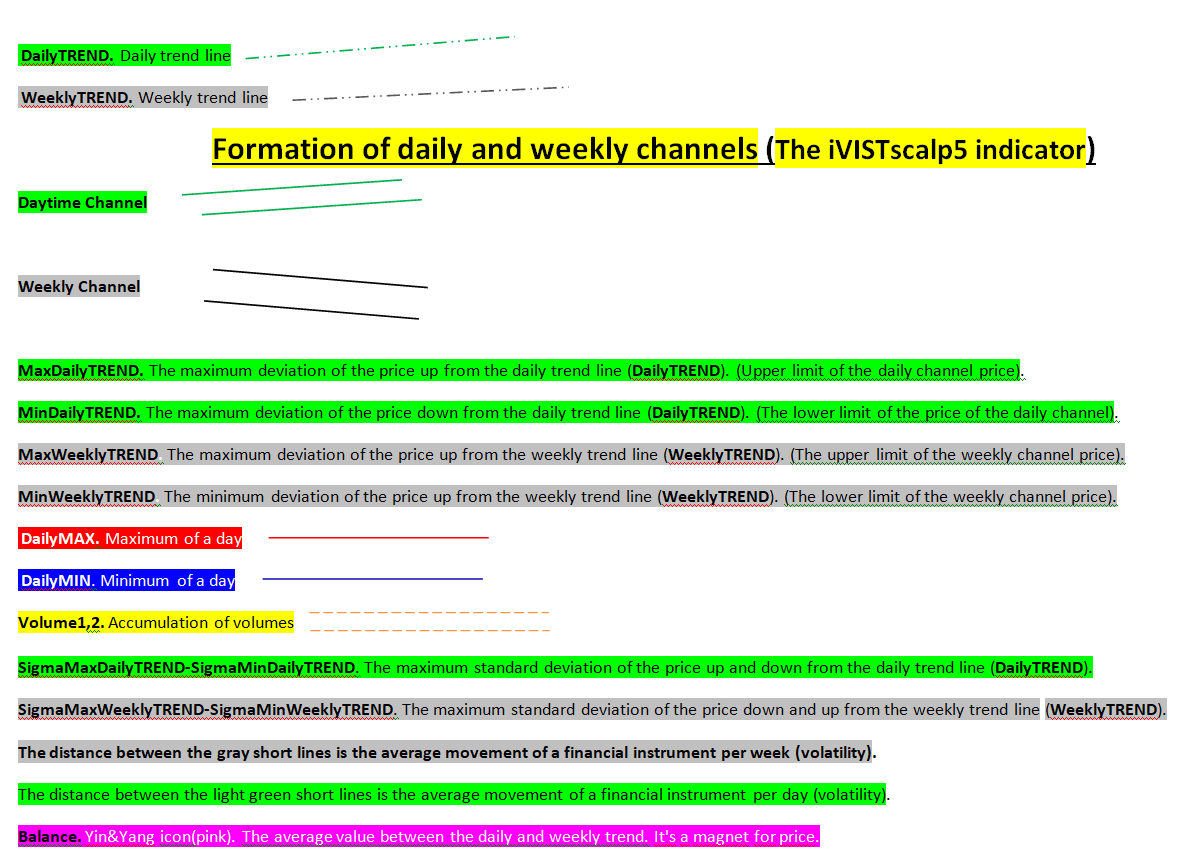
Daily and weekly channels in the iVISTscalp5 indicator

The iVISTscalp5 indicator. Scalping by time levels (timings). SigmaMax WeeklyTREND-SigmaMin WeeklyTREND. The maximum standard deviation of the price down and up from the weekly trend line (WeeklyTREND)
The iVISTscalp5 indicator has not only timings (time levels), but also the main levels to which the price of a financial instrument reacts. Levels and channels (daily and weekly) help us to analyze and make some decision. Today we will talk about the weekly trend and all the levels that are associated with it.
WeeklyTREND. The weekly trend line is defined in the iVISTscalp5 indicator by a dashed gray line. WeeklyTREND is the line that the price will definitely react to.
If the price moves for some time, you can build a channel. There are two channels in the indicator – daily and weekly. They are needed in order to easily determine where the price is in space at a given time. This is very important for scalping.
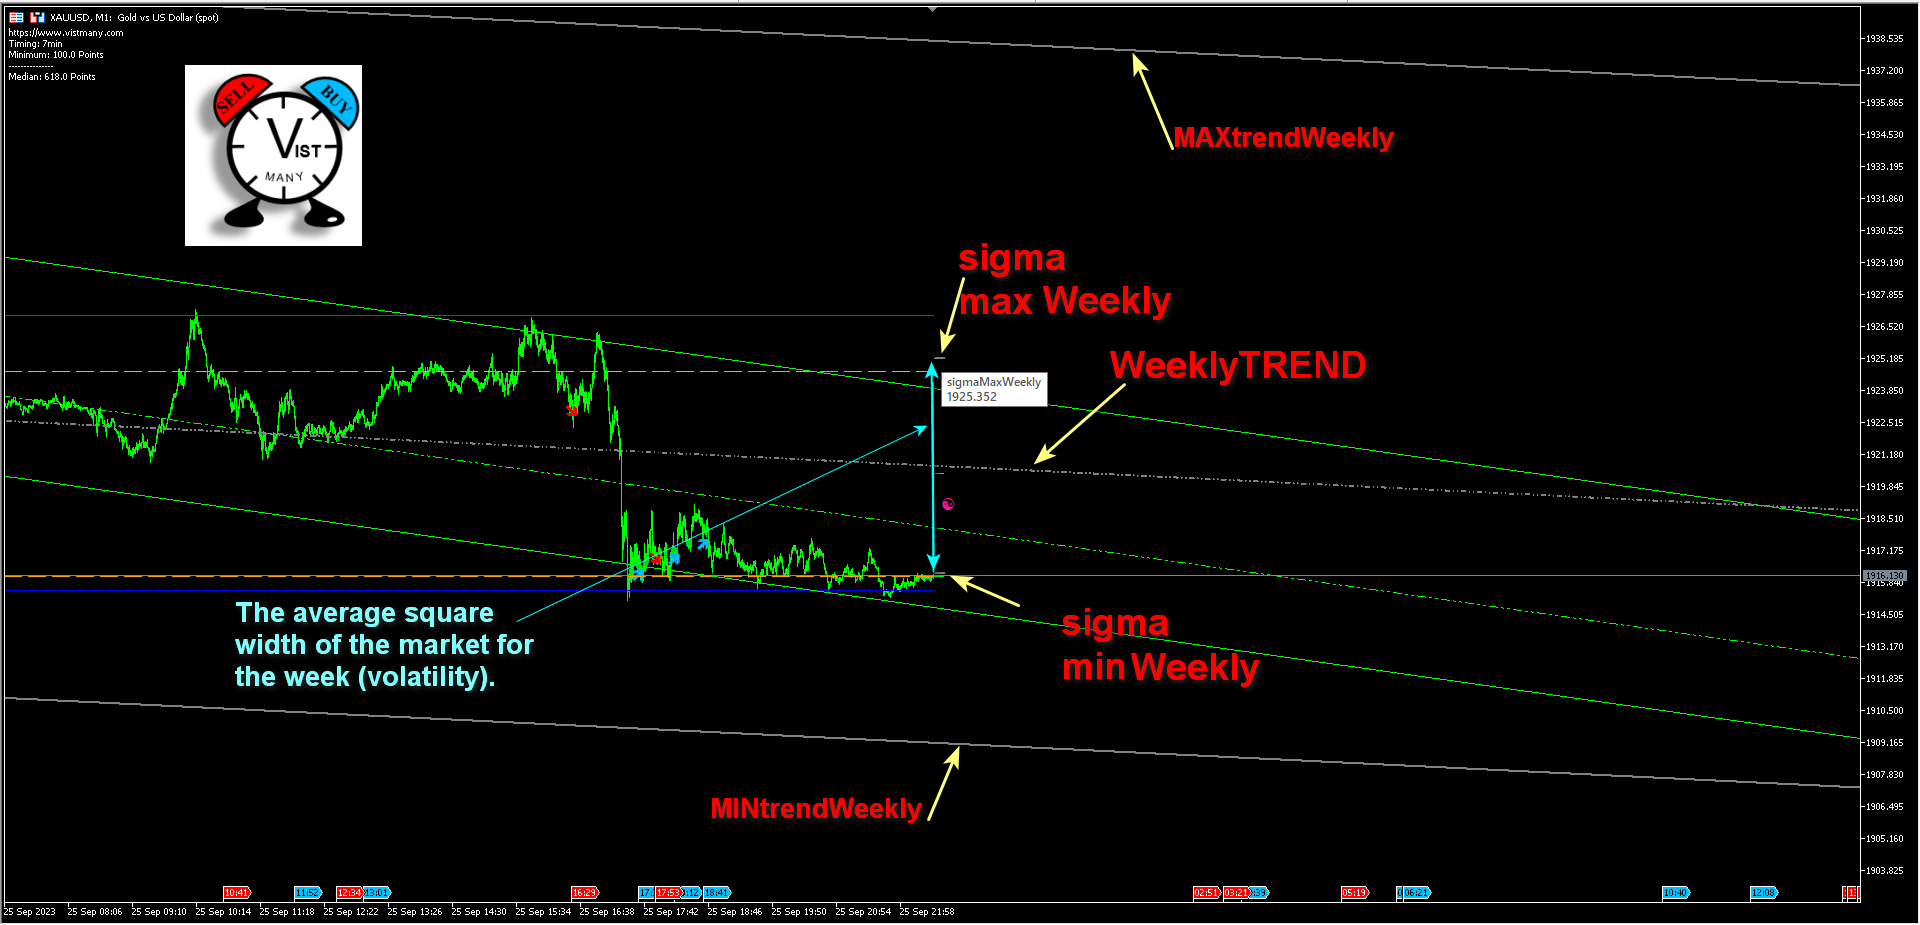 Now let's look at what the levels called SigmaMax WeeklyTREND and SigmaMin WeeklyTREND mean.
The maximum standard deviation of the price down and up from the weekly trend line (WeeklyTREND) is SigmaMax and SigmaMin. In another way, we can say that the distance between these gray levels is the average price movement for the week (volatility). If we go beyond the boundaries of the SigmaMax and SigmaMin levels, this is a zone of uncertainty. Very often at such moments, the price can update its extremes. Either there will be a new monthly (or weekly) maximum or minimum. Such moments are often called overbought or oversold by traders of the instrument.
Now let's look at what the levels called SigmaMax WeeklyTREND and SigmaMin WeeklyTREND mean.
The maximum standard deviation of the price down and up from the weekly trend line (WeeklyTREND) is SigmaMax and SigmaMin. In another way, we can say that the distance between these gray levels is the average price movement for the week (volatility). If we go beyond the boundaries of the SigmaMax and SigmaMin levels, this is a zone of uncertainty. Very often at such moments, the price can update its extremes. Either there will be a new monthly (or weekly) maximum or minimum. Such moments are often called overbought or oversold by traders of the instrument.How will our SigmaMax and SigmaMin levels help in trading on timings?
1) If we are above SigmaMax WeeklyTREND, ignore the buy timings, even if you then see that they worked well. We pay attention only to buy timings. Everything above is a sales area for scalping.
2) If we are below SigmaMin WeeklyTREND, ignore the sell timings. Everything below is a scalping shopping area.
3) If the price is trading between the SigmaMax WeeklyTREND and SigmaMin WeeklyTREND levels, then these levels can act as your take profit. But this is the case when the price is not far from these levels. Again, I remind you that we have a scalping system. We get a profit in a large lot with a small price movement.
4) In any case, remember that all the levels that are in the indicator, the price will definitely react to them. For example. If you have opened the sell timing, and after 600 points there is a SigmaMin WeeklyTREND level, then you close your deal at the SigmaMin WeeklyTREND level. Even if the sell timing forecast is greater than 600 points. Since there is a high probability from this level that the price can bounce up with an impulse.
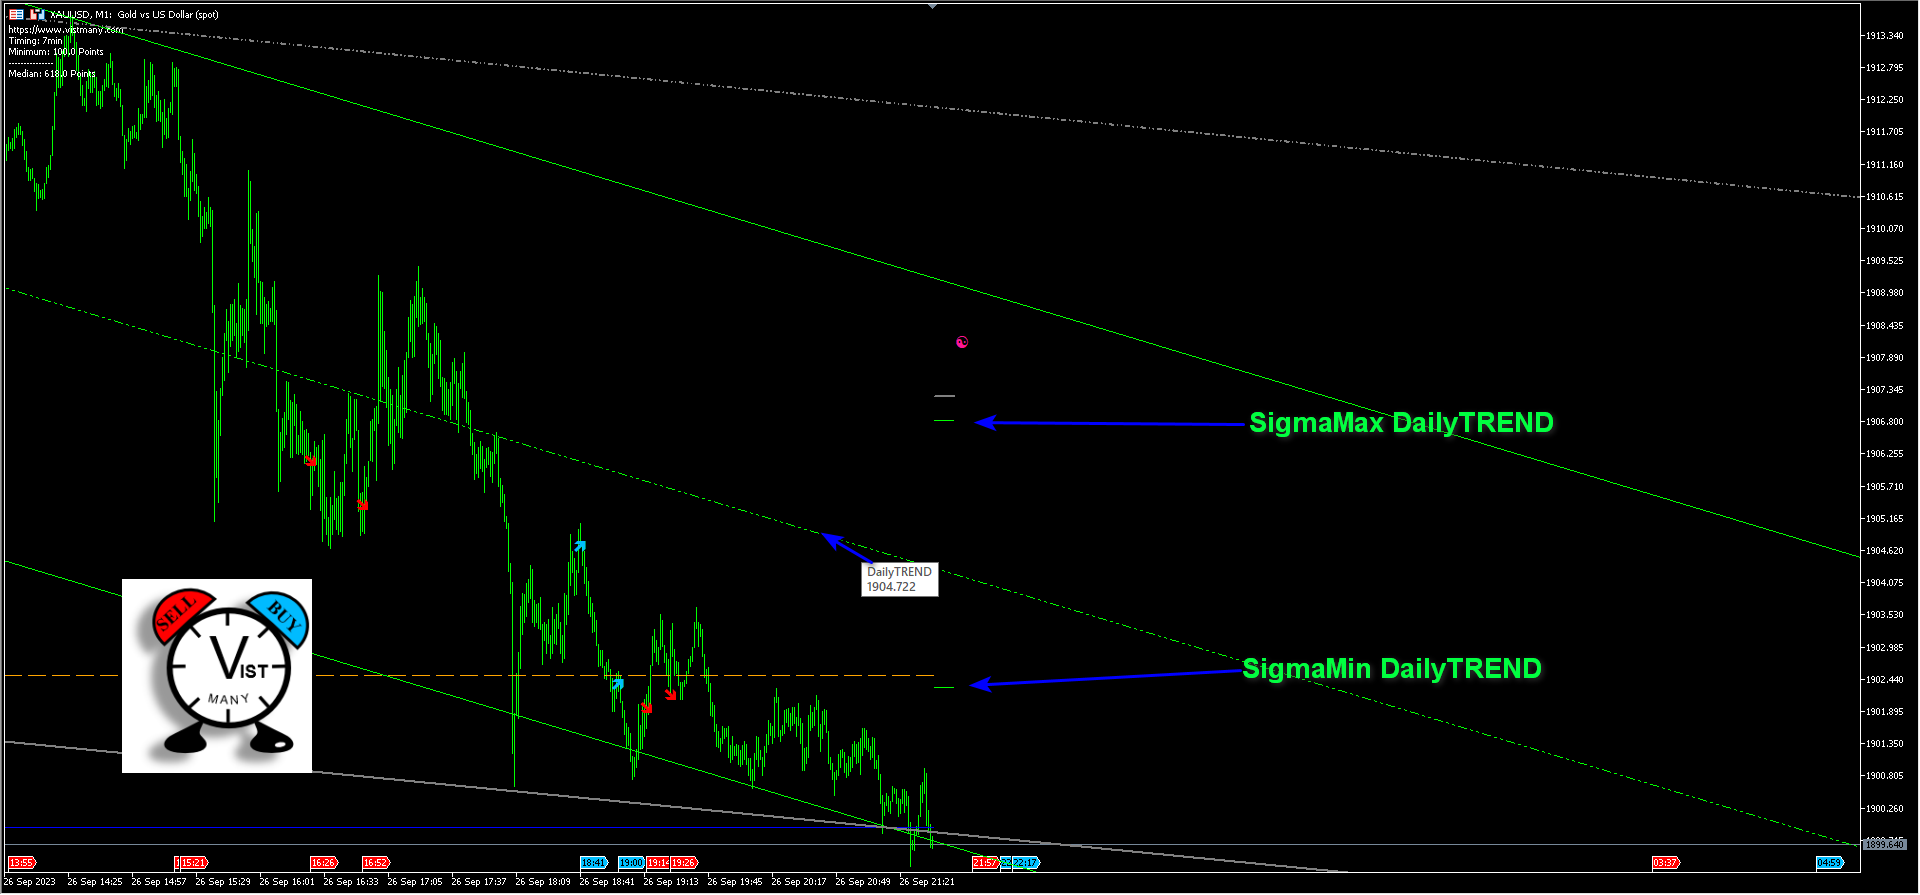 By analogy with SigmaMax WeeklyTREND and SigmaMin WeeklyTREND, there is also a daily channel and a daily trend. The daily trend (DailyTREND) has the maximum standard deviation of the price down (SigmaMinDailyTREND) and up (SigmaMax DailyTREND) from the daily trend line. The daily trend on the chart is indicated by a light green dashed line.
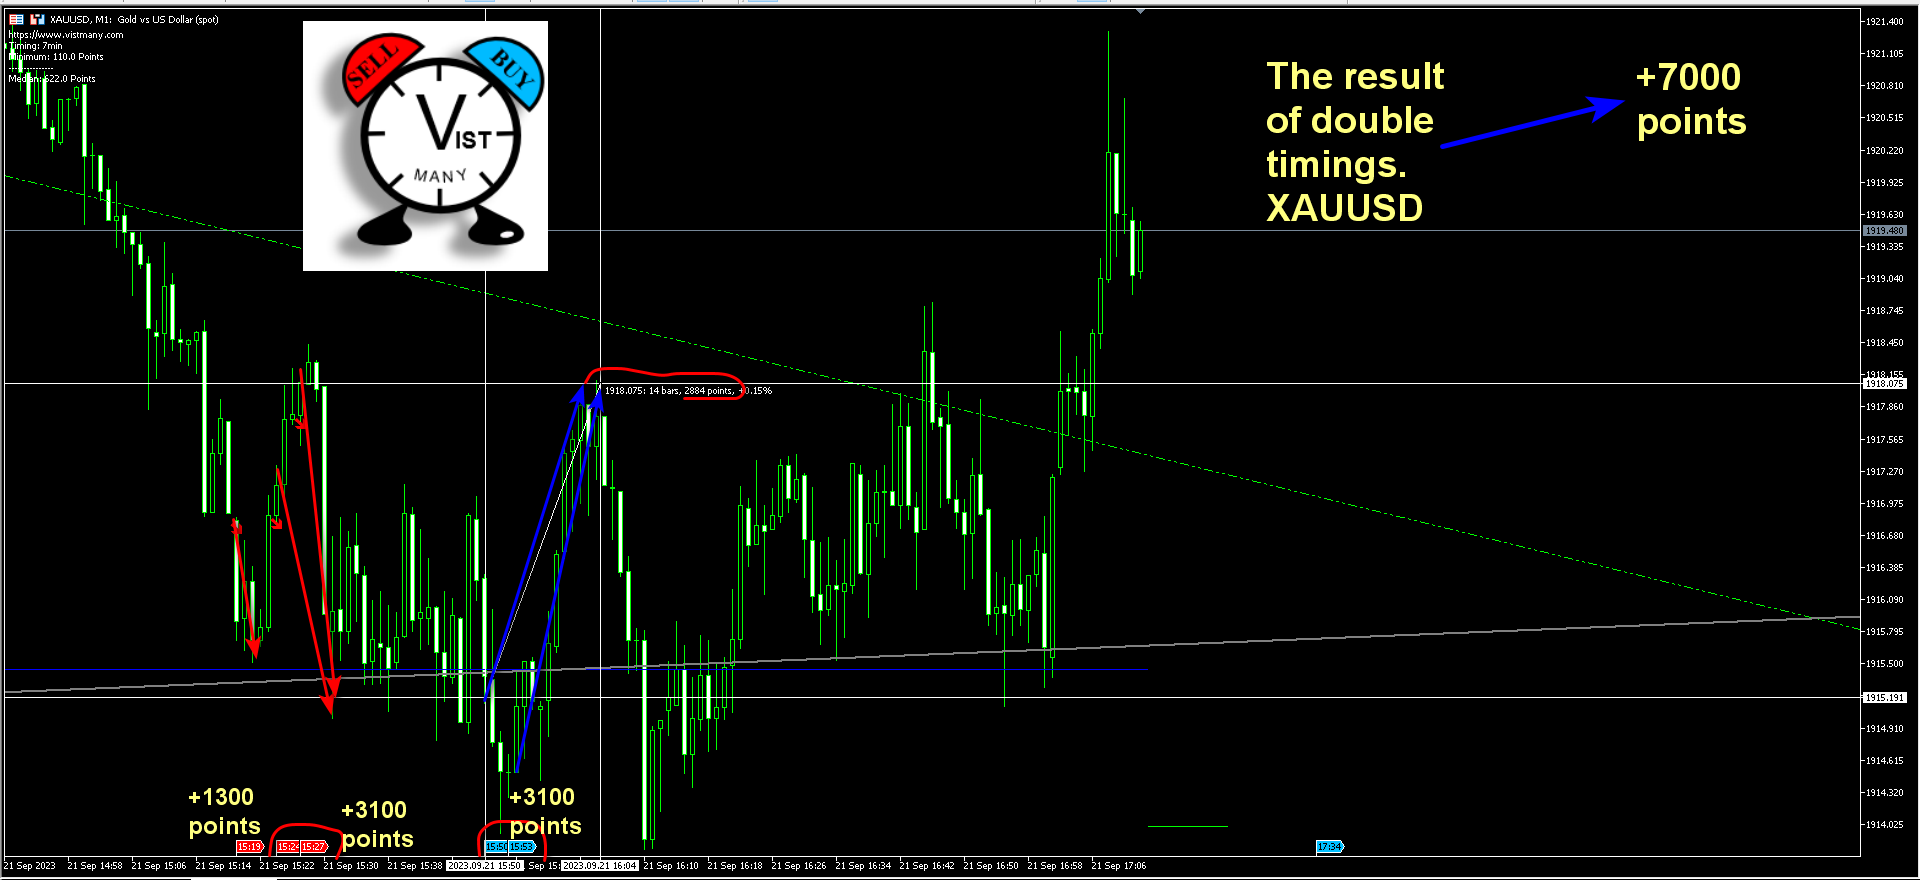
Double timings in the iVISTscalp5 indicator
Double timings are a great tool for making a profit. Let's look at the double timings for the XAUUSD pair that were today. Even a novice trader will be able to work with them and make a profit. We need to adhere to the basic rules of our system. At the maximum of the daily and weekly channels, do not enter the buy and at the minimum, respectively, do not enter the sell. I remind you that double timings are very close in time. Their interval is from 2 to 6 minutes.
 Good luck and profit to everyone! Before you start working on a real account, test double timings on other instruments. We recall a few more rules of the system. We are looking for the best entry using double timing. We look at the forecast of the system for each timing in points. Usually, timing works better, having a larger forecast for points. This is not always the case, but often. If the first timing of the pair worked, then we don't go into the second timing!
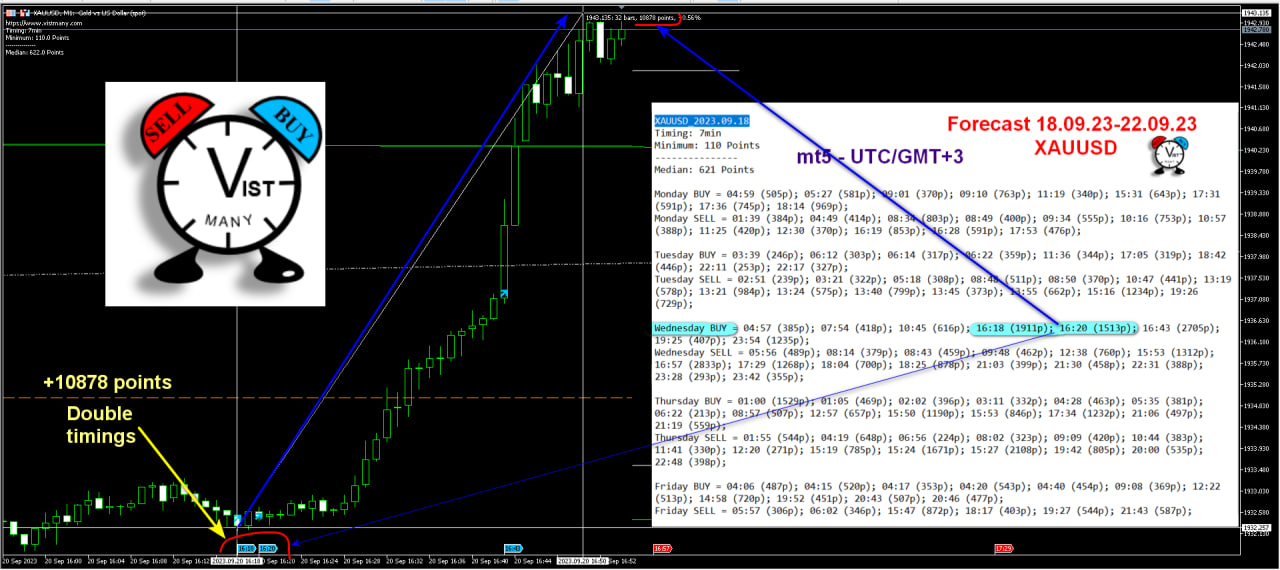
Double timing operation on the XAUUSD pair. Remember the rule of the system: if the first timing is in profit, we ignore the second timing. There are double timings on different instruments. It is comfortable to work with them. Test and apply in your strategy. Very often, double timings show an impulse towards the main movement of the instrument.
Timing spectra in the iVISTscalp5 indicator
Timing spectra
iVISTscalp5 Indicator Test
Trading by timings
The main settings of the iVISTscalp5 indicator for different trading weeks of the month
First, let's figure out how to determine the trading weeks of the month. Each week is very individual for trading. It is necessary to take this fact into account and make the settings of the iVISTscalp5 indicator more effective.
Using the example of 2024, we will learn how to determine the week number of the month. The numbering of the week in the financial market is determined by the first Thursday of the month. For example, January. The first Thursday is January 4th. Therefore, from January 1 to January 7 is the first trading week of the month. We take into account Saturday and Sunday, as there is a cryptocurrency market.

Let's define the first week in the month of March. The first Thursday is March 7th. Therefore, from March 4 to March 10 is the first trading week of the month.
Why do we need to know such information? Firstly, according to statistics, the forecasts of our VISTmany system are most effective in the second and third weeks of the month. Secondly, we often write that Thursday and Friday in the third trading week of each month, trading according to timings (forecasts) is not recommended for novice traders. Now you know how to determine the week number of the month.
In the first and last week of the month, we must take into account the main price levels in the vicinity of the forecast timings (time levels). The main settings of the indicator are shown below. Be sure to follow our recommendations. All options for the indicator settings are suitable for any financial instrument.
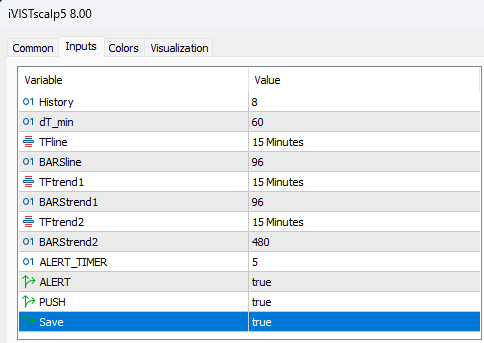
iVISTscalp5 indicator parameters for the 2nd and 3rd trading weeks of the month
The iVISTscalp5 indicator parameters for 2 and 3 trading weeks can be applied to any financial instrument by default.
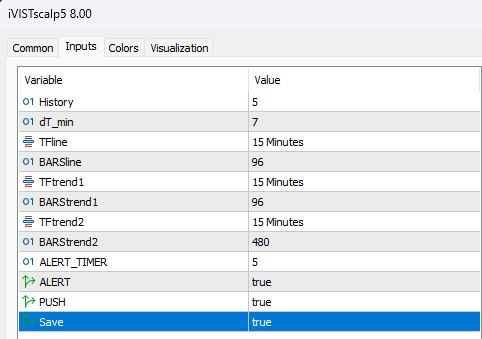
The first option is for 2-3 weeks (by default)

The second option is for 2-3 weeks
iVISTscalp5 indicator parameters for the 1st and 4th trading weeks of the month

The first option is for weeks 1 and 4 (by default)
The second option is for the 1st and 4th weeks of the month
Remark
Be sure to test the iVISTscalp5 indicator in the strategy tester of the MetaTrader 5 terminal. This will help you quickly find the most effective forecasts of the iVISTscalp5 indicator timings for your trading style.
 iVISTscalp5 Indicator
Timings is an innovative scalping system. From idea to implementation. Basic concepts of time levels (timings).