VISTmany

Researching Financial Markets Through Time
TLV LAP TPA TSI

Time Structure Research of Financial Markets


TIME

Forecasted timings.
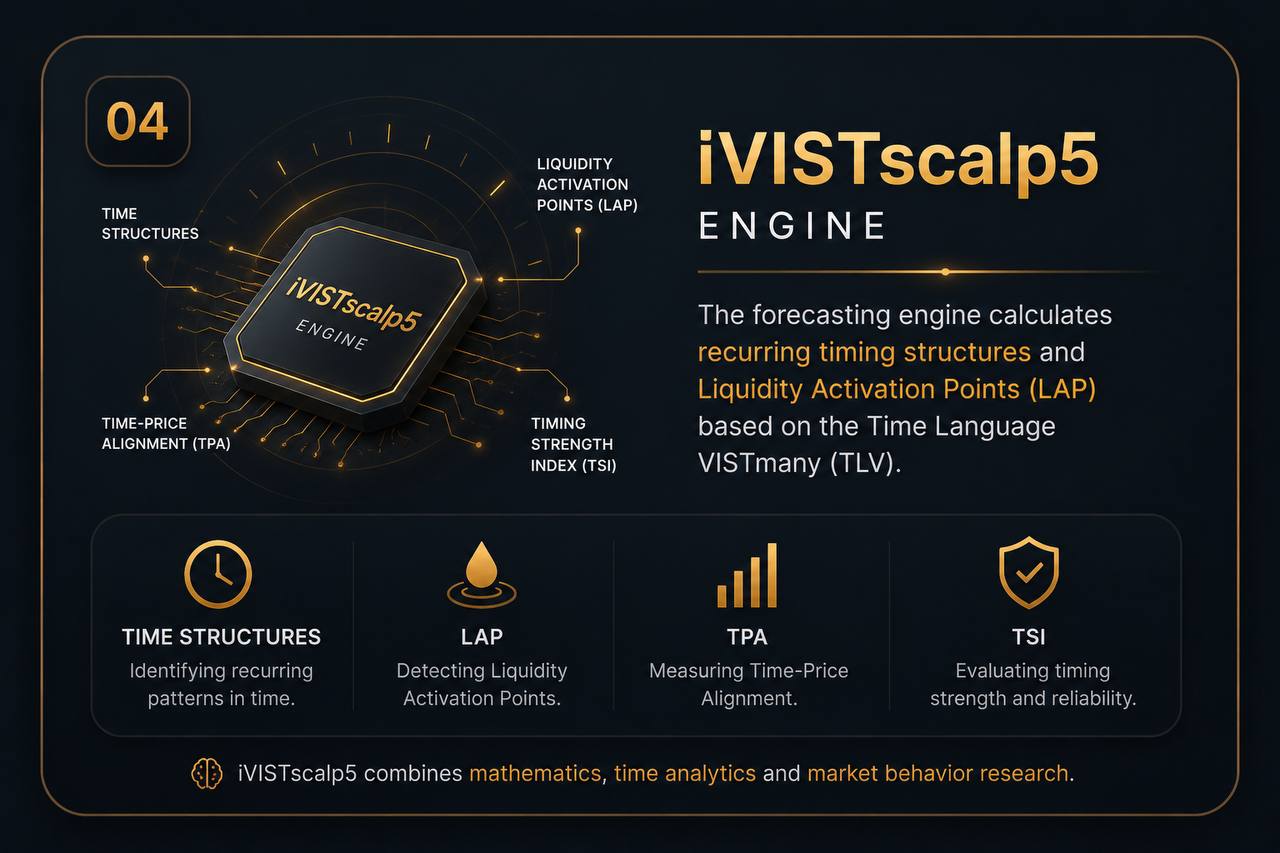
Liquidity Activation Points (LAP).

PRICE

Reaction levels.
Time-Price Alignment (TPA).

LIQUIDITY

Market activation.
Momentum Clusters.
Timing Strength Index (TSI).

EXECUTION

Trading decisions.
High-probability timing execution.

The market moves when time activates price.

TLV • LAP • TPA • TSI


What Are Liquidity Activation Points?

Liquidity Activation Points (timings) are specific moments in time where the market statistically demonstrates increased probability of movement, volatility expansion or liquidity reaction.

A timing itself is not simply a BUY or SELL signal.

The direction always depends on:

  • market context
  • nearby price structure
  • liquidity conditions
  • momentum behavior
  • interaction with t(p) and p(p) levels

The timing only defines when the market is structurally ready to move.


Momentum Clusters

When several timings appear close to each other, they form Momentum Clusters (also called timing spectrums).

Momentum Clusters often increase the probability of:

  • liquidity expansion
  • false breakouts
  • reversal structures
  • aggressive sweeps
  • intraday volatility acceleration

These structures are one of the core research areas inside the TLV (Time Language VISTmany) framework.


TLV Language (Time Language VISTmany)

Foundation

Market = Time × Price

t(p) — Time

p(p) — Price


Terminology (Standard)

Liquidity Activation Point (Timing) = the moment of liquidity activation
(acceptable short form: timing)

Momentum Cluster = timing spectrum = a group of timings creating impulse

p(p) — Price Level = price levels (structure)

t(p) — Time Level = the price level at the moment of timing activation

Time–Price Alignment (TPA) = alignment of time and price

Impulse = the result of activation

Exhaustion = movement exhaustion


Core Formula

Impulse = t(p) × p(p)


Core Idea

The market does not move because of price.
The market does not move because of time.

The market moves when time activates price.


Timing Research

The current research focuses primarily on:

  • 7-minute timing structures
  • 30-minute structures
  • 48-minute structures
  • 54-minute structures
  • 60-minute structures

Historical observations show that different market phases may respond differently to different timing intervals.

The project continues to study how these structures interact with:

  • market phases
  • trading weeks
  • volatility cycles
  • liquidity behavior
  • intraday transitions

Important Research Principle

If price was already moving in the direction of the timing before activation, the timing should generally be ignored.

Example:

  • if price was rising before a BUY timing
  • or falling before a SELL timing

then the market may already be in liquidity exhaustion phase.

In such cases, the preferred approach is to wait for:

  • pullback toward t(p) levels
  • interaction with p(p) levels
  • confirmation from market context

This principle is one of the foundations of the TLV framework.


About The Research

VISTmany is an ongoing independent research project.

The goal is not to provide financial advice or guaranteed outcomes, but to study recurring timing behavior in financial markets and explore the interaction between time, liquidity and price structure.

The project currently studies:

  • forex markets
  • CFD instruments
  • gold (XAUUSD)
  • indices
  • crypto markets
  • intraday volatility structures

Trade Time. Not Price.

Learn more