VISTlab – forecasting and trading laboratory
The VISTlab laboratory developed the
iVISTscalp5 indicator and the
ScalpAuT expert, which work in the MT5 terminal according to time levels (timings). These tools are already loved by many traders who use their home computer to trade Forex. Until now, many of our subscribers, traders who prefer to use mobile applications for trading, have remained without technical support. For some traders it was often a problem to compare the time of our MT5 terminal and their own terminal. Now for them, a
VISTlab page has appeared on our website, where an indicator works on-line around the clock, which calculates the forecast of the market entry point (timings) on different instruments.
The site presents 27 financial instruments for analysis and trading. If you are interested in more than 125 instruments (MT5 terminal), then purchase the iVISTscalp5 indicator for your desktop computer. For those who like algorithmic trading, the ScalpAuT trading advisor is at your service. The most mobile traders can trade on our website in the VISTlab tab in real time.
At the very top of the page you can find a tab with the tools that our web version of the iVISTscalp5 indicator offers. Here you will find that there is only one tool freely available. To access the entire list of tools, you will have to sign up for a paid subscription. Currently available tools:
XAUUSD – Gold
XAGUSD – Silver
EURUSD – Euro
GBPUSD – Pound Sterlingd
USDJPY – Japanese ena
USDCAD - Canadian Dollar
AUDUSD - Australian Dollar
DXY - Index USA Dollar
RUSSELL2000 - Index RUSSELL2000 USA
NGAS - Natural Gas
COFFEE - Coffee
DowJones30 – Dow Jones
Nasdaq100 – NASDAQ
DAX30 – DAX
S&P500 – S&P500
WTI– Oil
AAPL.US - Apple Inc
NVDA.US - NVIDIA Corporation
ETHUSD – Ether
BTCUSD – Bitcoin
BCHUSD - Bitcoin Cash
BNBUSD - Binance coin
DSHUSD - Dashcoin
ADAUSD - Cardano
SOLUSD - Solana
UNIUSD - Uniswap
XRPUSD - Ripple

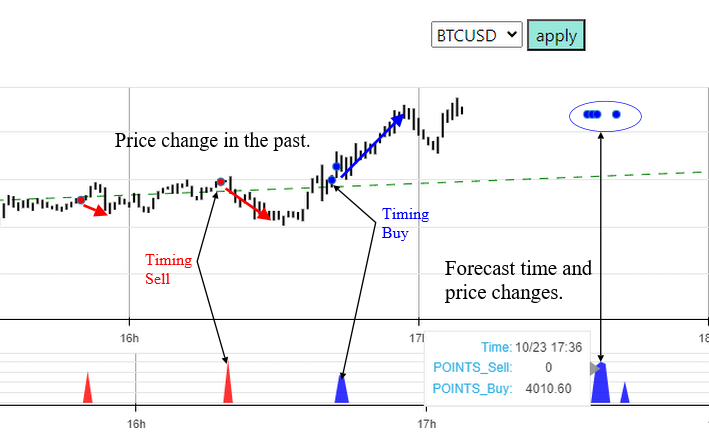
The figure below shows a price chart of a financial instrument with red and blue timings plotted as dots. Timings are represented not only by dots on the chart, but also separately at the bottom of the chart in the form of red and blue figures. The first 3 hours on the chart show timings that have already worked. On the right side of the chart is a forecast of timings that will occur in the next three hours. Here we can see the time when you need to buy/sell, as well as the predicted number of points that can be your profit.
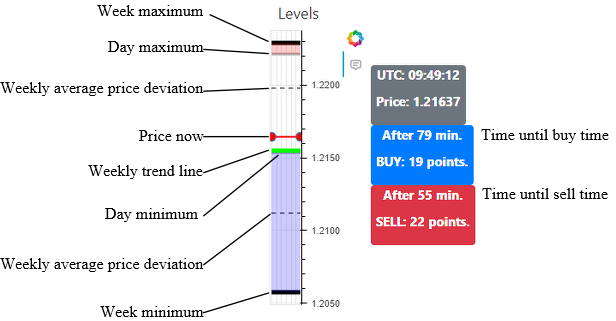
An integral attribute of any forecast is the probability of the event. The probability of timing execution is about 90-95%. The most effective 2nd and 3rd trading weeks (95%). The first and last weeks the probability decreases to 90%. You must understand that the timing system does not completely eliminate the risks of unsuccessful trades. To assess risks, we suggest using a chart of main price levels, an example of which is shown below.
Let's look at a few examples.
Example 1.
Let's analyze a fragment on the XAUUSD pair. On the chart there are SELL timings (red dots), followed by BUY timings (blue dots). As you can see, the SELL timings did not all work out the predicted movement. If we look at the levels chart, we will notice that the price is at the low of the week. In this case, we recommend ignoring the range of SELL timings.
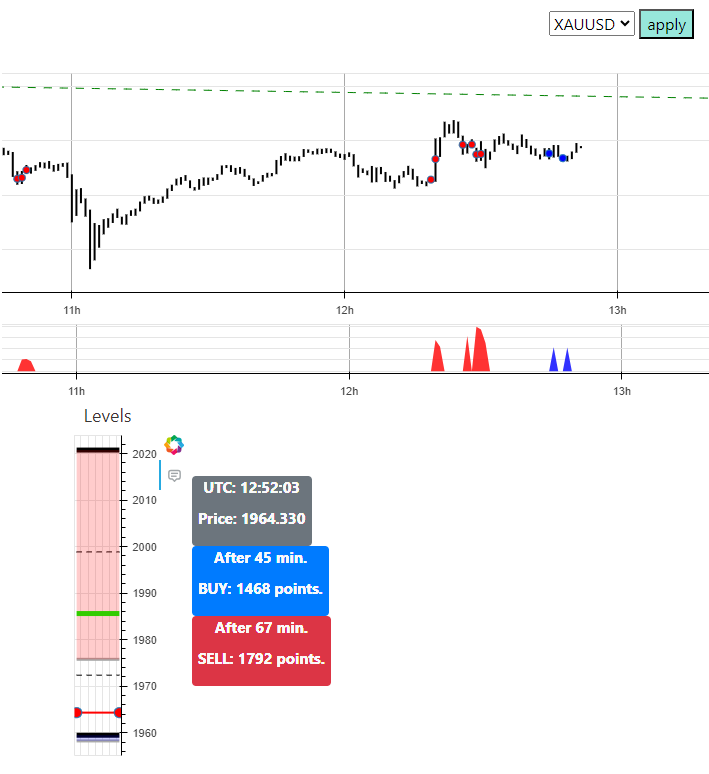
Obviously, it is better to wait for entry according to the BUY timings. And it is desirable that the price drops to the nearest level below (in this case, the minimum of the week).
Example 2.
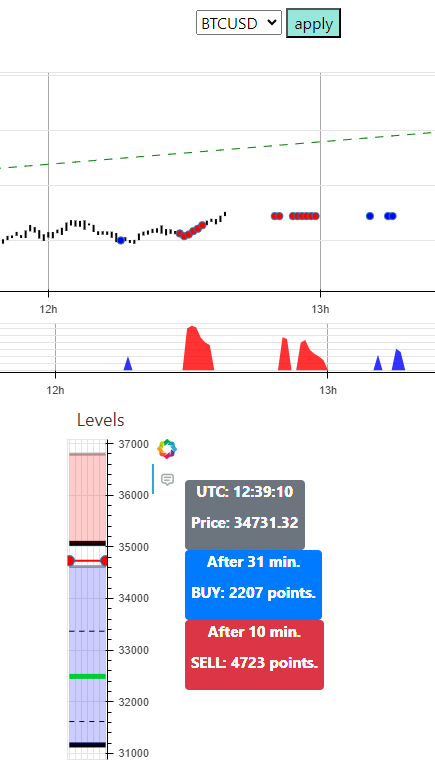
The figure shows the BTCUSD price chart. We see that the price has approached a wide range of SELL timings. At the same time, on the levels chart we are at the low of the day. The situation is ambiguous. The correct option would be to wait until the price reaches the nearest upper level and enter the next series of SELL timings.
At first glance, it may seem that everything is too complicated. This is wrong. In 90-95% of cases, timings work even against price levels. But the main levels will help you ignore 5-10% of forecasts that can ruin your deposit.
Life hack for beginners.
The picture below shows an example of an ideal selling situation. The price updated its high of the week and its high of the day. After 7 minutes the SELL timing follows. In such a situation, there will be a 99.9% price correction on which you will make money if you open a sale according to timing.
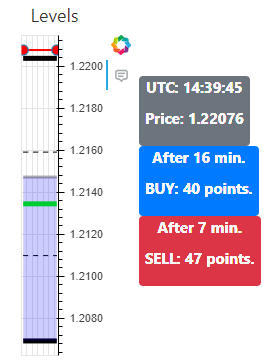
Such ideal situations occur on one instrument at least twice a week. If you watch ten instruments on our site, that's at least 20 excellent trades per week that will easily increase your deposit by 50% or more.
More details at the link.
The figure below shows the entry points for the current day.

Express analysis
We have already said that there is a 5-10% chance that the timing will not work. You must understand that not all timings are signals to open a trading order. After a detailed analysis, you can make, for example, up to 5 transactions per day. There is no need to enter each timing without analysis. First of all, make sure that you don’t end up buying at the high of the day or week, or vice versa – selling at the low of the day or week. On the other hand, a trader must know how to properly exit unsuccessful trades if you opened an order and the timing did not work.
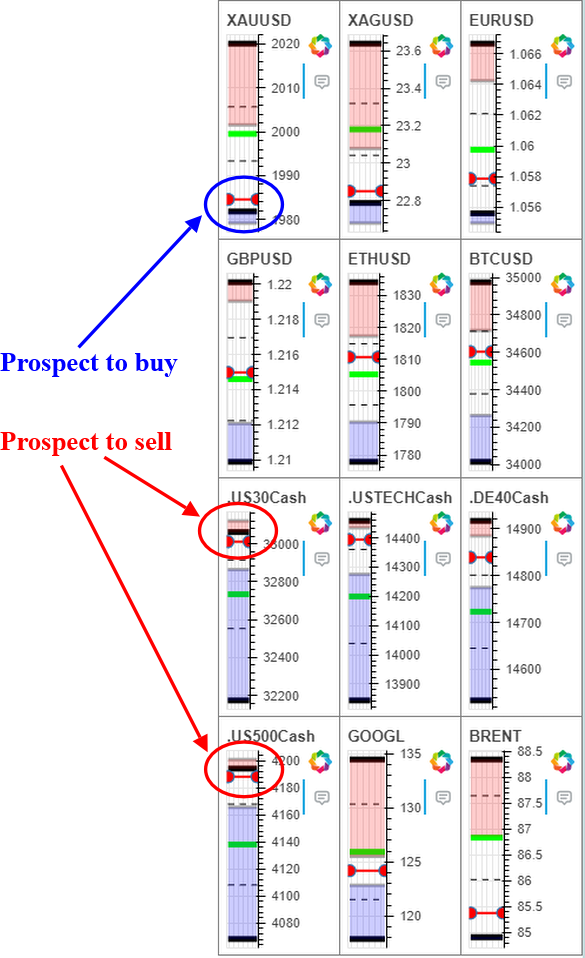
Let us describe an example of transactions that carry minimal risks. To do this, consider the table of express analysis of weekly levels in conjunction with timings. The first thing you look for on the map are instruments where you need to take a closer look at purchases when the price approaches the low of the weekly channel. Sell when the price approaches the weekly channel high. Such trades are especially suitable for novice traders.
Let's imagine that we did a quick analysis. For example, on the XAUUSD pair the price approached the lower border of the weekly channel. Next, we look to see if there is a buy timing at a time when the price is within the low of the weekly channel. Let's say that there is a buy timing and we bought a pair of XAUUSD. In such situations, the price can go according to two scenarios:
1. The first scenario – the price will make a sharp impulse from the extremum of the channel border and immediately move towards the open order. The order can be closed according to the timing forecast, or it can be moved to breakeven (Stop Loss can be moved to a positive profit area). Next, you make your own decision about closing the order based on the amount of profit.
2. Now consider the second scenario, less successful. We opened a buy order using timing on the XAUUSD pair at the lower border of the weekly channel. But the price broke through the level and continued its downward movement. At this point, we must remember that the price almost always returns to the timing that did not work. We analyze where the next level is, where the price can go, or look at where the next buy timing is. We open an order there. We place take profit at the level of the first open order. Anyone who knows the order averaging method can apply their knowledge.
Thus, trading from weekly extremes is the safest. The deal can be held much longer than under other conditions. Even if the price did not immediately move in your direction, there is always a high probability that the price, after updating new extreme levels, will return to your losing trade, opened according to the timing forecast. But we must definitely conduct an analysis, especially of those situations that can lead to losses. And the most important thing is to know how to resolve such situations.
 VISTmany