Temporal Causality: From Temporal Correlation to Market Activation
Can recurring temporal structures be interpreted not only as correlated with market movement, but as potential precursors of liquidity activation? This article introduces the concept of Temporal Causality as a research hypothesis rather than as an established causal law. The proposed framework distinguishes temporal coincidence, temporal correlation, temporal synchronization, temporal resonance, and temporal causality. The primary computational instrument of this research is the iVISTscalp5 framework, developed within the VISTmany project. Its computational results provide the temporal forecasts through which the hypothesis can be observed, tested, and refined.
1. From Correlation to Causality
A recurring temporal relationship does not automatically imply causality. If a temporal event repeatedly appears before a price movement, several explanations are possible.
The relationship may represent:
coincidence;
statistical correlation;
a common underlying mechanism;
synchronization between independent processes;
or a genuine causal relationship.
Therefore, observing that price movement frequently follows a timing is only the beginning of the investigation.
The scientific question is more demanding:
Does the temporal structure contain information that precedes and contributes to the activation of market movement?
This distinction is essential for the development of the VISTmany framework.
2. The Evolution of the Temporal Hypothesis
The VISTmany research programme has progressively moved through several conceptual stages.
The first stage was the observation of timings.
A timing represented a recurring temporal point associated with subsequent market activity.
The next stage introduced Liquidity Activation Points (LAP).
The timing was no longer treated simply as a clock coordinate. It became a methodological representation of a potential moment of liquidity activation. Further research revealed that individual timings could form larger structures.
These structures were described through:
- Temporal Spectra;
- Temporal Density;
- Temporal Space;
- Temporal Stability;
- Temporal Memory;
- Temporal Resonance;
- Multi-Spectral Temporal Synchronization;
- Cross-Market Temporal Synchronization.
3. What Is Temporal Causality?
Within VISTmany, Temporal Causality is defined as a testable hypothesis:
A sufficiently stable temporal structure may precede and contribute to the activation of liquidity and the subsequent development of price movement.
The wording is deliberately cautious. The hypothesis does not state that Time mechanically causes Price. Instead, it proposes that temporal information may represent an observable component of the mechanism through which liquidity becomes activated. This leads to a conceptual relationship:
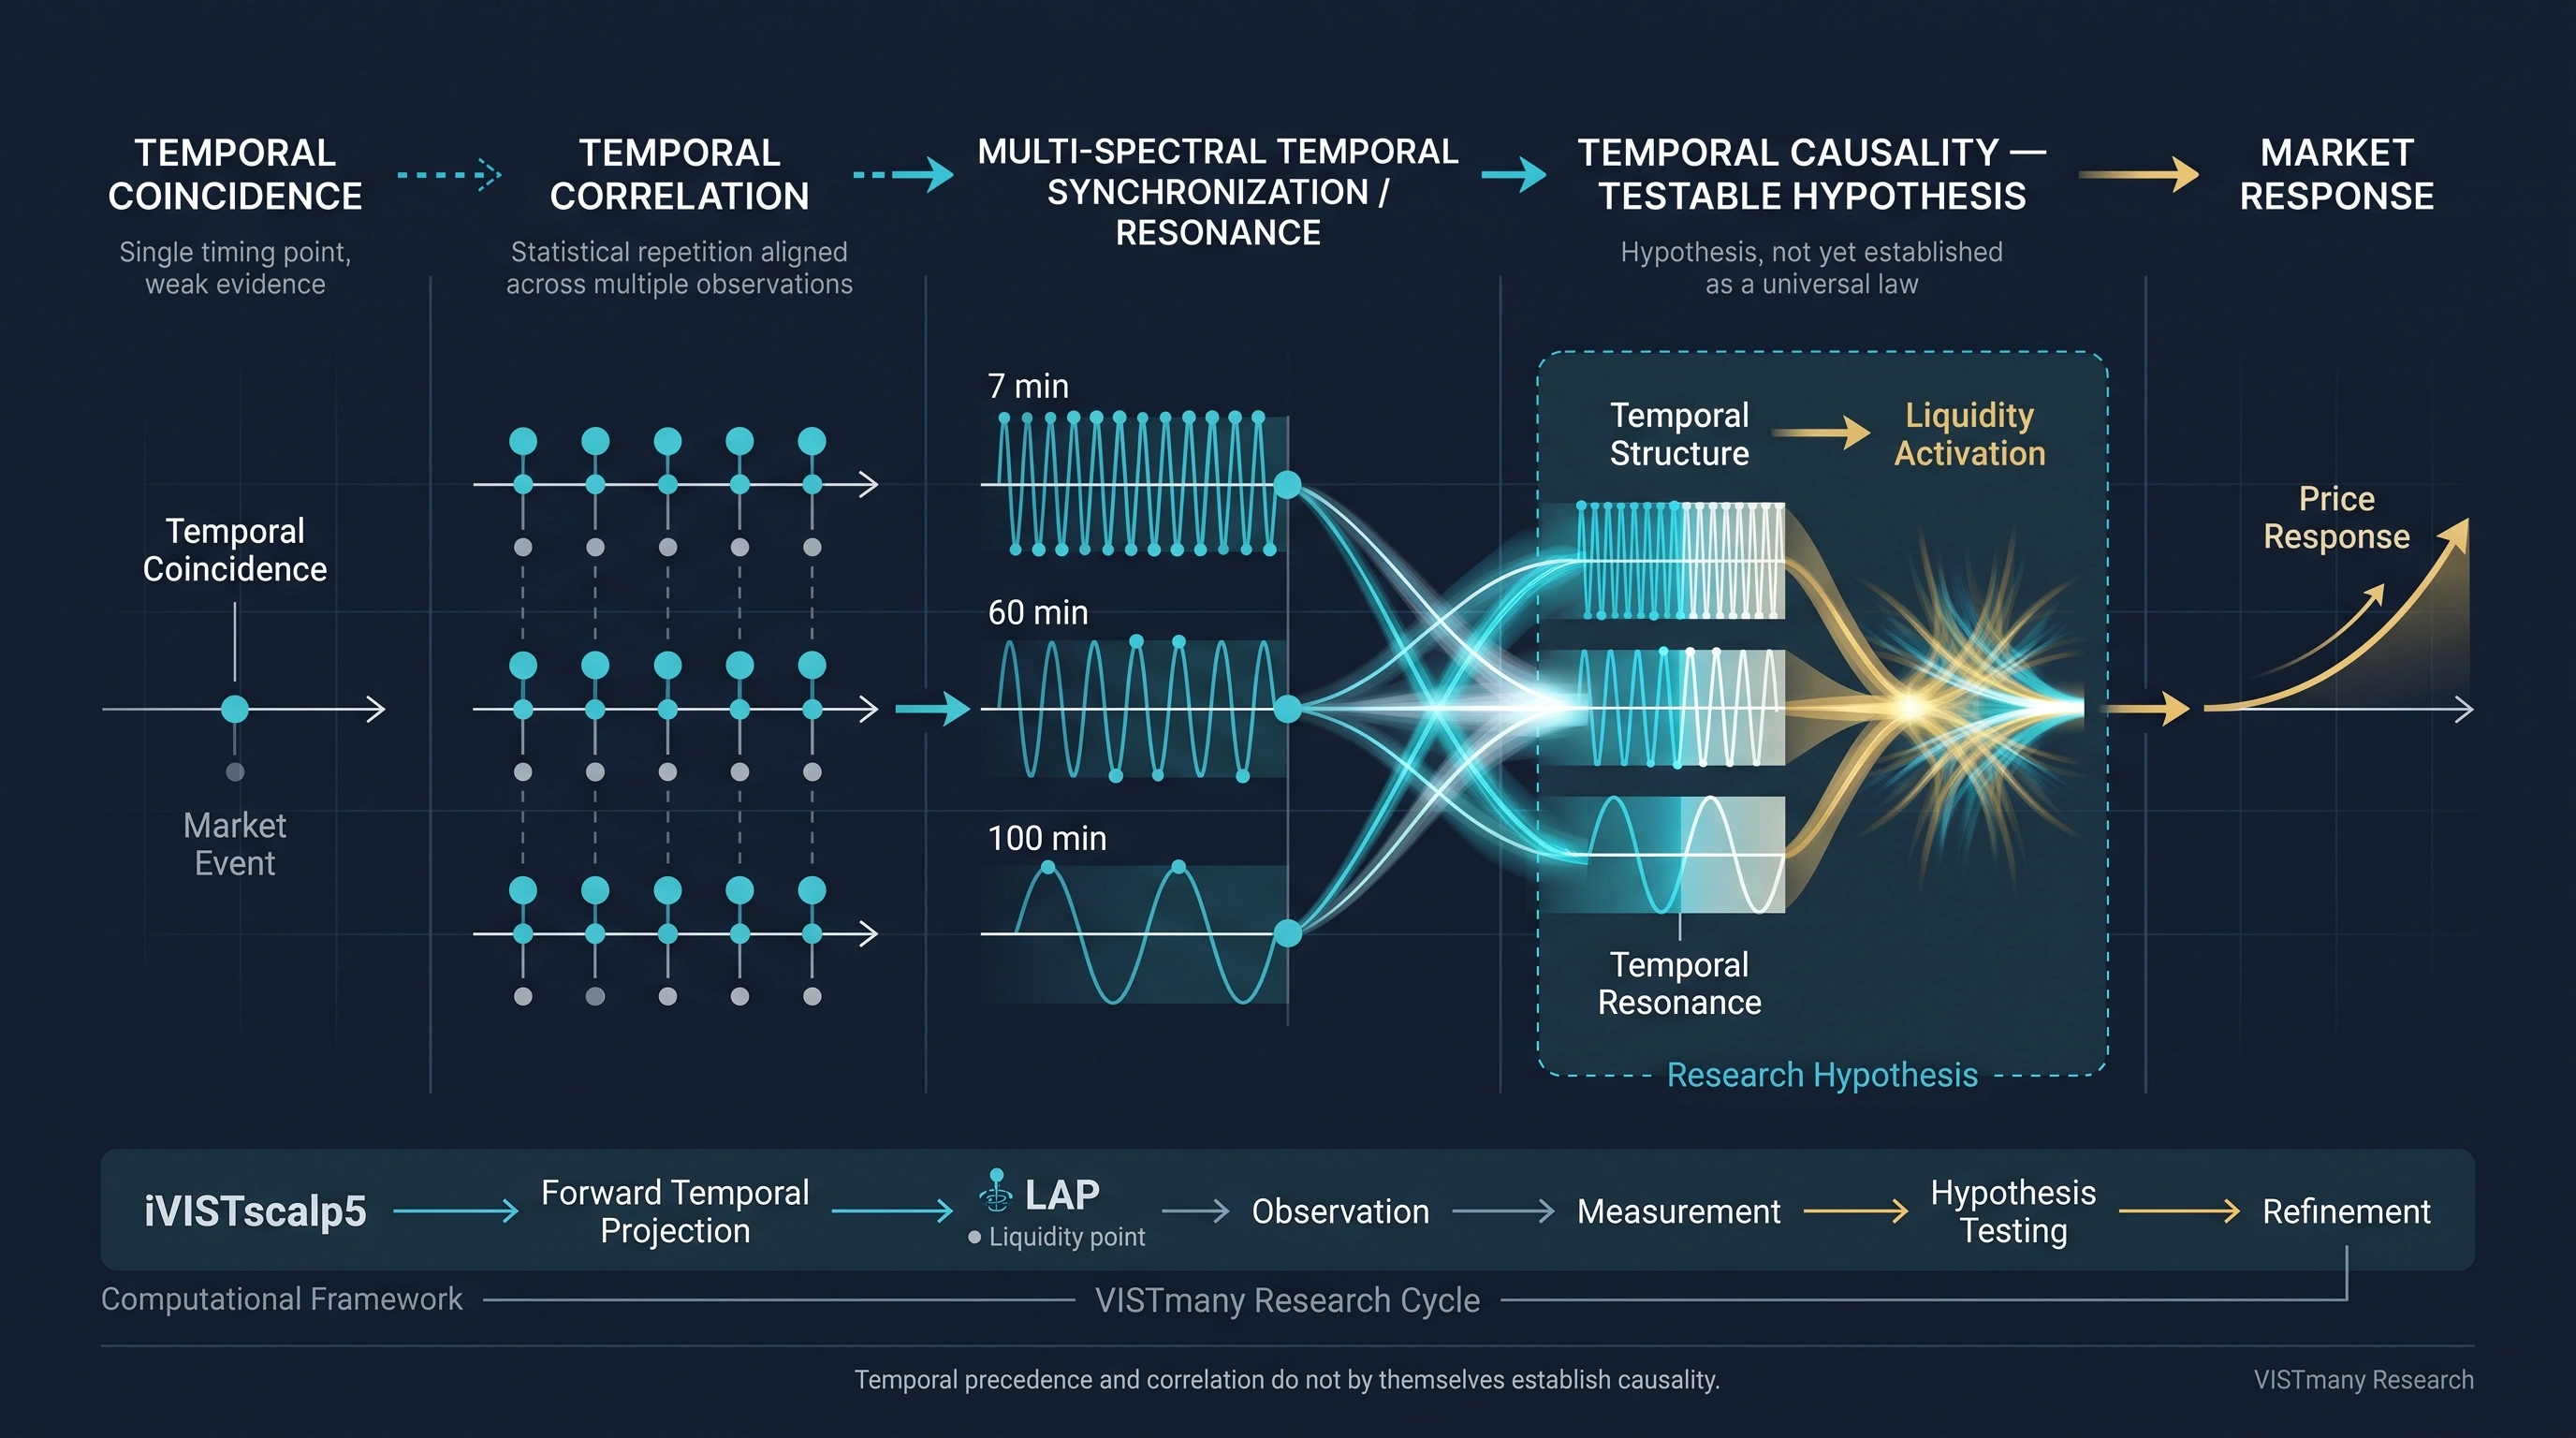
Temporal Structure → Liquidity Activation → Price Response
The research objective is to determine whether this sequence contains statistically significant and reproducible information.
4. Timing Is Not the Same as Causality
A LAP occurring before a market movement does not, by itself, establish causality.
For example, suppose a timing occurs at: 10:30
and a significant movement begins at: 10:32.
The observation establishes temporal precedence. But temporal precedence alone is insufficient. A stronger research framework must examine:
whether similar relationships occur repeatedly;
whether the relationship survives different market conditions;
whether it appears across different instruments;
whether timing clusters provide stronger evidence than isolated timings;
whether the relationship remains when obvious alternative explanations are considered;
whether the temporal structure can be identified before the movement occurs.
The last point is particularly important.
A structure that can only be identified retrospectively has substantially weaker predictive value than one that can be calculated in advance.
5. The Importance of Forward Calculation
One of the central characteristics of VISTmany research is the use of forward-looking temporal projections.
The iVISTscalp5 framework calculates forecasted temporal points rather than identifying them only after price movement has occurred.
This creates an important distinction:
Retrospective temporal analysis
Price movement → identify previous timing
versus:
Forward temporal projection
Historical information → calculate future timing → observe subsequent market behaviour
The second approach provides a basis for empirical testing. A forecast can be recorded before the market response. The subsequent behaviour can then be compared with the forecast without changing the original temporal hypothesis retrospectively.
6. The Role of iVISTscalp5
iVISTscalp5 is the primary computational framework of the VISTmany project.
The theoretical concepts developed by VISTmany are closely connected to the computational observations generated by iVISTscalp5.
The framework calculates two principal forecast dimensions:
Temporal information and expected price movement.
This allows the research to examine the relationship between: when and how much.
The computational framework also allows temporal structures to be studied across different intervals.
Consequently, the research does not depend on a single timing. It can investigate the interaction between multiple temporal structures and their possible relationship with subsequent market activity.
7. Temporal Coincidence
The weakest form of temporal relationship is Temporal Coincidence.
A timing and a market movement occur close to each other in time.
For example: LAP: 10:30
Price movement: 10:31–10:35
This is an observation. It does not yet establish a persistent relationship. A large number of such observations is required before stronger conclusions can be considered.
8. Temporal Correlation
If similar temporal relationships occur repeatedly, the next level is Temporal Correlation.
For example:
LAP → market activation
appears repeatedly across a sufficiently large observation set.
The correlation becomes more interesting when:
the timing is calculated in advance;
the same methodology is used consistently;
the observation period is extended;
multiple instruments are examined.
However, correlation still does not establish causality.
9. Temporal Synchronization
A stronger structure occurs when independent temporal processes repeatedly converge.
For example:
7-minute structure
60-minute structure
may produce temporal points that occur close together.
The convergence of multiple temporal structures creates a higher-order temporal configuration.
This is the basis for the VISTmany concept of Multi-Spectral Temporal Synchronization.
Synchronization is therefore different from simple temporal correlation.
It describes a structural relationship between multiple temporal processes.
10. Temporal Resonance
When several independent temporal structures converge within a narrow temporal region, VISTmany describes the resulting amplification as Temporal Resonance.
Conceptually:
Independent temporal structures
↓
Synchronization
↓
Temporal concentration
↓
Potential amplification of liquidity activation
↓
Price response
Temporal resonance therefore represents a mechanism through which multiple temporal structures may reinforce the informational significance of a particular temporal region.
11. From Resonance to Causality
Temporal Causality asks a more difficult question. Suppose a temporal resonance occurs repeatedly before significant market movement.
Three possibilities remain:
Hypothesis A — coincidence
The relationship is accidental.
Hypothesis B — common driver
Both temporal structure and price movement are consequences of another hidden variable.
Hypothesis C — temporal activation mechanism
The temporal structure is connected to the mechanism through which liquidity becomes activated. The purpose of further VISTmany research is to distinguish between these possibilities. This requires systematic testing rather than interpretation of individual examples.
12. A Proposed Experimental Framework
A temporal-causality experiment can be structured around five stages.
Stage 1 — Forecast
Calculate future LAPs using the established methodology.
Stage 2 — Freeze the forecast
Record the temporal prediction before the corresponding market interval begins.
Stage 3 — Observe
Record the subsequent market behaviour.
Relevant variables may include:
activation time;
direction;
maximum movement;
time to maximum movement;
delay from LAP;
volatility;
market regime.
Stage 4 — Compare
Compare observed market behaviour with the forecast.
Stage 5 — Repeat
Repeat the experiment across:
different instruments;
different temporal intervals;
different market regimes;
different historical periods.
This transforms a qualitative observation into a reproducible research process.
13. Measuring Temporal Response
One possible research variable is the Temporal Response Delay.
Let:
t_{LAP} represent the forecasted LAP;
t_{activation} represent the observed beginning of significant market movement.
Then the temporal response delay can be represented conceptually as:
\Delta t = t_{activation}-t_{LAP}
The distribution of \Delta t may provide useful information. If the distribution is broad and unstable, the timing may have limited predictive value. If the distribution demonstrates a stable concentration around a particular range, the relationship becomes more interesting. This does not prove causality. It provides a measurable object for further investigation.
14. Temporal Causality and Temporal Density
Temporal Density may provide another important dimension.
A single LAP represents one temporal observation. A dense temporal structure represents the simultaneous appearance of multiple temporal components.
Therefore, the research question becomes:
Does the probability or magnitude of market activation change as Temporal Density increases?
For example:
Low density
One temporal structure appears.
Moderate density
Several structures appear within a narrow interval.
High density
Multiple temporal structures from different intervals converge. If market response systematically changes with temporal density, this would provide additional evidence that temporal structure contains information beyond isolated timing events.
15. Temporal Causality Across Markets
The cross-market dimension provides another important test.
If similar temporal structures appear across:
Forex;
metals;
commodities;
cryptocurrencies;
indices;
equities,
the research can investigate whether the phenomenon is instrument-specific or represents a broader property of financial markets.
This leads to another hypothesis:
If temporal activation structures are generated by mechanisms common to financial markets, their statistical properties may exhibit cross-market similarities.
Cross-market temporal synchronization therefore becomes not only an observation, but a possible test of the universality of the temporal framework.
16. Predictive Direction and Movement
Temporal causality should also be distinguished from direction forecasting.
A temporal point may indicate:
When to pay attention.
It does not necessarily determine:
What price must do.
This distinction is fundamental. The VISTmany framework therefore separates:
Temporal activation
from
Price response.
The expected movement calculated by iVISTscalp5 provides an additional quantitative dimension for studying the relationship.
The research can therefore investigate:
Timing → direction → movement magnitude
rather than treating a timing as a simple binary trading signal.
17. Falsifiability
A scientific temporal framework must allow the possibility of being wrong.
Temporal Causality should therefore be considered falsifiable.
The hypothesis would be weakened if repeated experiments demonstrated that:
LAPs have no stable temporal relationship with subsequent activity;
temporal response delays are indistinguishable from random timing;
temporal density does not correspond to changes in market behaviour;
temporal structures disappear under different market conditions;
cross-market similarities cannot be reproduced;
forward forecasts fail to demonstrate information beyond retrospective interpretation.
These possibilities are not failures of the scientific method.
They are necessary conditions for testing the hypothesis objectively.
18. Why This Matters
If temporal structures contain reproducible information about future market activation, financial-market analysis may need to reconsider the role assigned to Time. Instead of viewing Time as merely the horizontal axis of a price chart, it could become an independent analytical dimension.
The conceptual model would then evolve from:
Price → Time axis
toward:
Time ↔️ Liquidity ↔️ Price
This would represent a significant change in how financial market structure could be studied.
19. The VISTmany Research Position
VISTmany does not present Temporal Causality as an established universal law.
At this stage, it is a research hypothesis derived from a sequence of empirical and computational observations.
The purpose of the VISTmany research programme is to determine whether these observations represent:
statistical coincidence;
persistent correlation;
temporal synchronization;
temporal resonance;
or a deeper causal relationship.
The iVISTscalp5 computational framework provides the primary experimental mechanism for conducting this investigation.
VISTLAB provides an environment in which temporal structures can be observed and studied in real time.
Together, these components create a continuous research cycle:
Computation → Forecast → Observation → Measurement → Hypothesis → Testing → Refinement
Conclusion
The transition from Temporal Correlation to Temporal Causality represents an important step in the development of the VISTmany research programme.
The central question is no longer simply:
Does a market movement occur near a forecasted timing?
The deeper question is:
Does the temporal structure contain information about the mechanism through which liquidity becomes activated?
Answering this question requires forward calculations, controlled observation, quantitative measurement, repeated experiments, and attempts at falsification.
The VISTmany framework therefore treats Time not as a decorative coordinate on a chart, but as a measurable research variable.
iVISTscalp5 provides the computational framework.
LAP provides the temporal representation.
Temporal Space provides the structural environment.
Temporal Density, Resonance, Memory and Synchronization provide higher-order structures.
Temporal Causality represents the next hypothesis to be tested.
The research therefore continues from the observation of when markets move toward the more fundamental question of why temporal structures may precede market activation.